9.7. Media Transport System with Design Study Tutorial (MTT2D)
9.7.1. Getting Started
9.7.1.1. Objective
This tutorial will help you learn how to use the design study capability of RecurDyn with the 2D Media Transport Toolkit (MTT2D). You will learn how to create design variables from parametric values and how to define performance indices. This tutorial uses the basic model defined in the first MTT2D tutorial as shown in the figure below. It contains three cases, each of which is progressively more sophisticated:
In the first case, you perform a simple design study with a single parameter to analyze the effect of paper thickness.
In the second case, you perform a design of experiments, which lets you analyze two variables: paper thickness and curl.
In the third case, you also consider the x and y locations of two of the guides.
9.7.1.2. Audience
This tutorial is intended for experienced users of RecurDyn who previously learned how to create geometry, joints, force entities, and 2D contacts. All new tasks are explained carefully.
9.7.1.3. Prerequisites
You should first work through the 3D Crank-Slider, Engine with Propeller, and Pinball (2D contact) tutorials, or the equivalent. We assume that you have a basic knowledge of physics.
9.7.1.4. Procedures
The tutorial is comprised of the following procedures. The estimated time to complete each procedure is shown in the table.
Procedures |
Time (minutes) |
Simulation environment set up |
10 |
Case 1: Parametric Study of Paper Thickness |
20 |
Case 2: Design of Experiments with PaperThickness and Curl |
30 |
Case 3: Design of Experiments with a MovingGuide Assembly |
45 |
Total |
105 |
9.7.1.5. Estimated Time to Complete
60 minutes
9.7.2. Setting Up Your Simulation Environment
9.7.2.1. Task Objective
Learn how to set up the simulation environment and adjust the MTT2D model for the design studies
9.7.2.2. Estimated Time to Complete
10 minutes
9.7.2.3. Starting RecurDyn
9.7.2.3.1. To start RecurDyn and create a new model:
On your Desktop, double-click the RecurDyn icon. RecurDyn starts and Start RecurDyn dialog box appears.
Exit the Start RecurDyn dialog box.
Open a copy of the RecurDyn model file that you created in the first MTT2D tutorial, and save it to a new file name, such as MTT2D_DOE.rdyn.
Enter the MTT2D subsystem by doing one of the following:
In the Database window, right-click MTT2D1 subsystem and select Edit.
In the Working window, double-click the MTT2D subsystem geometry.
9.7.2.4. Adjusting the MTT2D Model from the First MTT2D Tutorial
In this section, you will adjust the model you created for the first MTT2D tutorial by changing.
The motion to move the rollers 20 times faster.
The penetration parameter to 5 from the default of 2.
The penetration parameter is a scale factor used to set the guide contact to continue to act while the sheet penetrates a depth of the sheet thickness multiplied by the penetration parameter. You need a larger penetration parameter because of the increased sheet speed.
9.7.2.4.1. To adjust the model:
In the Database window, under the Expression category, right-click Ex1, and click Properties.
Adjust the motion expression to move the rollers 20 times faster by changing it to 40*TIME rather than 2*TIME. Note that this change will affect both RevJoint20 and RevJoint22 because both of these joints reference EX1.
Display the Properties dialog box for the MTT2DAssembly1 (last item in the Database window) and do the following.
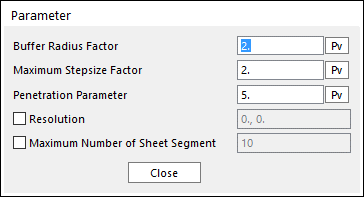
In the Contact List page, click Parameter.
Adjust the Penetration Parameter to 5.
Display the Dynamic/Kinematic Analysis dialog box and set.
End Time to 0.4
Step to 220
Plot Multiplier to 5
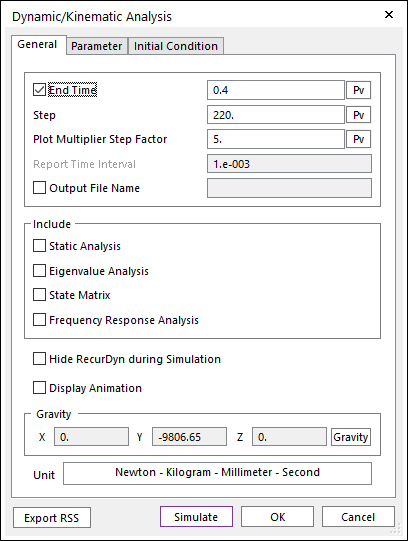
You can run the simulation for a shorter time because of the faster sheet speed.
Click OK to save the parameters and exit the dialog box.
9.7.3. Case 1: Parametric Study of Paper Thickness
In this chapter, you will perform a parametric study to determine the effect paper thickness has on the behavior of the paper in the MTT2D model. The RecurDyn simulation results will show the results that are to be expected: that the paper sticks out more to the left as the paper thickness increases (less drooping of the paper).
9.7.3.1. Task Objective
Learn to:
Set parametric and design variables
Set the performance index, the simulation output that you will track
Run a design study
9.7.3.2. Estimated Time to Complete
20 minutes
9.7.3.3. Setting Up the Parametric Variable for Paper Thickness
Your first step is to set up the parametric variable for paper thickness. This replaces the value of paper thickness with a variable.
9.7.3.3.1. To set up the parametric variable:
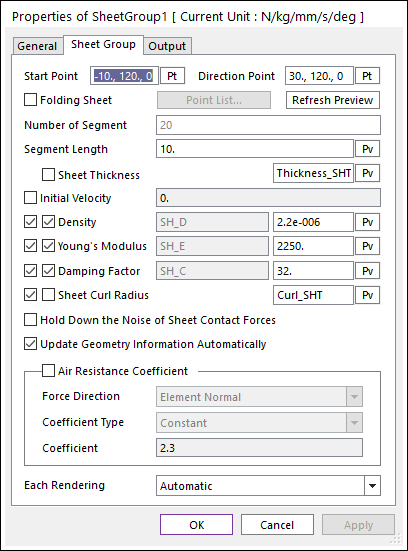
Display the Properties dialog box for the group, SheetGroup1.
In the Sheet Group page, clear the Sheet Thickness check box. Then, click Pv (Parametric Value) next to Sheet Thickness.
In the Parametric Value List dialog box, click Add.
Set the parametric value name to Thickness_SHT and the value to 0.5.
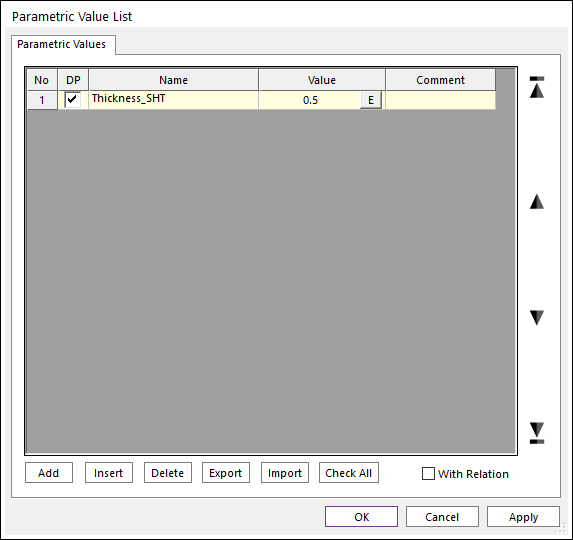
Click OK to exit the Parametric Value List dialog box.
The parametric value name appears in the Sheet Thickness text box in place of the value that was there previously.
Click OK to exit the SheetGroup1 Properties dialog box.
9.7.3.4. Setting Up the Design Variable for Paper Thickness
Now you will set the design variable for paper thickness based on the parametric value you just created for paper thickness. As you run the design study, RecurDyn varies this variable to find the optimum thickness for paper.
9.7.3.4.1. To set the design variable:
From the Design Study group in the SubEntity tab, click the Design Variable function.
In the Design Variable List dialog box, click Create.
In the Design Variable dialog box, next to the Value text box, click Pv.
Select the Thickness_SHT parametric value and click OK.
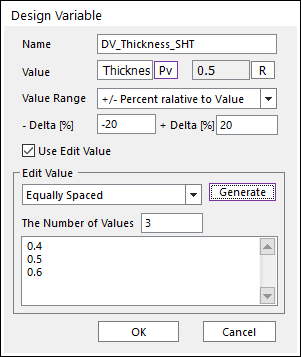
Set the name of the design variable to DV_Thickness_SHT.
The Value Range should be at its default setting of +/- Percent relative to Value.
Set the Delta values to be -20% and +20%.
Check Use Edit Value.
Set Edit Value to Equally Spaced and set the Number of Values text box to 3.
Click Generate and you should see the values of 0.4, 0.50, and 0.6.
Click OK to close the Design Variable dialog box and return to the Design Variable List dialog box.
Make sure that Design Variable No. 1 is selected in the Design Variable List and click OK.
9.7.3.5. Setting Up the Performance Index
For this simple example, you will track the minimum x value of the leading point of the sheet. This will be your performance index and will tell you how far the sheet extends to the left as it exits the second nip pair.
9.7.3.5.1. To set the performance index:
From the Design Study group in the SubEntity tab, click the Performance Index function.
In the Performance Index List dialog box, select Expression as the Type in the lower left corner and click Add.
In the Performance Index - Expression dialog, set the name of the Performance Index to PI_Reach.
Set Treatment to Min Value.
Click EL to open the Expression List.
Click Create.
Set the expression name to SHT_Reach_Exp.
Under the Argument List section, click Add.
In the Database Window, expand Bodies > SheetBody1 > Markers.
Drag Marker3 into the text box with the ID of 1 under the Argument list.
Enter the expression DX(1).
The DX function with one argument outputs the displacement of the marker in the x-axis of the global coordinate system. The number 1 refers to Marker3 because it is in the Argument List with an ID of 1.
Click OK to exit the Expression dialog box.
With the Expression No. 2 selected, click OK to exit the Expression List dialog box.
With the Performance Index No. 1 selected, click OK to exit the Performance Index List dialog box.
9.7.3.6. Setting Up and Running the Design Study
Now you will set up and run the design study. You will run three trials for each value of the design variable.
9.7.3.6.1. To set up and run the design study:
On the Analysis tab, in the Simulation Type group, click the Design Study function. The DOE dialog box opens.
In the Design Variable page, click Create Table with DV. You can see that 3 cases are created in the DOE table.
Since there is only one design variable and the number of levels in DV_Thickness_Sht is 3, 3 cases are created.
If you click the Performance Index page and check it, you can see that the Performance Index created earlier is applied.
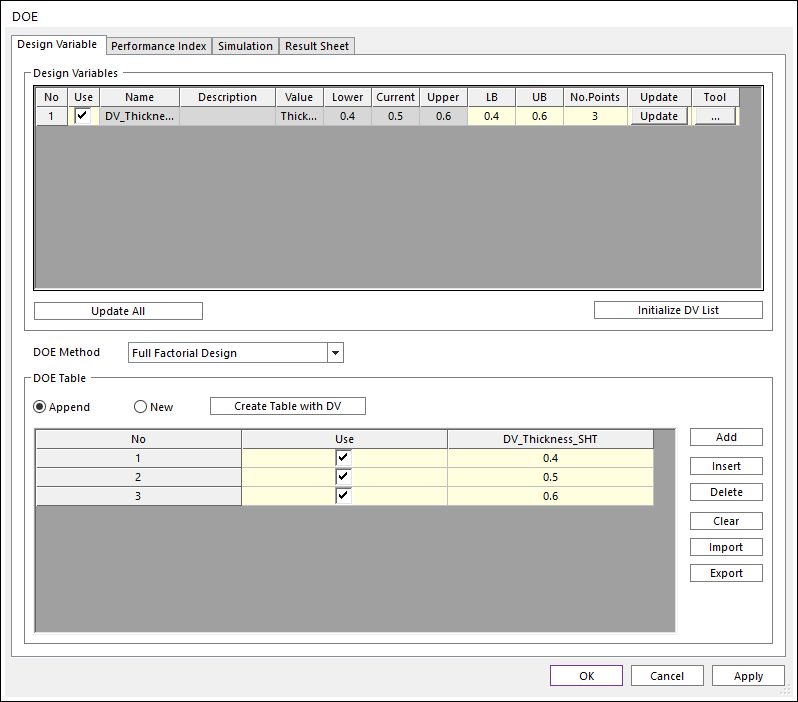
Click the Simulation page and click R for Number of Trials to recalculate the number you are trying. it should be 3.
Click Simulate to run the design study.
RecurDyn runs three simulations, one for each value of the design variable.
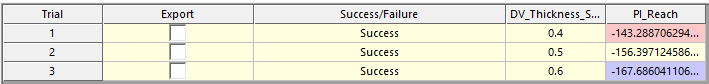
In the DOE dialog box, click Result Sheet page to see a summary of the simulations as shown in the figure to the below. The results show that the paper sticks out more to the left as the paper thickness increases (less drooping because thicker paper is stiffer than thinner paper).
Click OK to close the DOE dialog box
9.7.4. Case 2: Design of Experiments with Paper Thickness and Curl
In this chapter, you will run a design of experiments to determine the effect of paper thickness and paper curl. You will only need to create a variable for paper curl because you will use the variable you created for paper thickness in the previous case.
9.7.4.1. Task Objective
You will:
Create parametric and design variables for paper curl
Set up and run a design of experiments
9.7.4.2. Estimated Time to Complete
30 minutes
9.7.4.3. Setting Up the Parametric Variable for Paper Curl
9.7.4.3.1. To set up the parametric variable:
Display the Properties dialog box for Sheet Group1.
In front of Sheet Curl Radius, click the first check box and clear the selection of the second check box, as shown in the figure on the below.
Click Pv (Parametric Value) for Sheet Curl Radius.
In the Parametric Value dialog box, click Add.
Set the parametric value name to Curl_SHT and the value to 200.
Make sure the row with the Curl_SHT parametric value is selected and click OK.
The parametric value name appears in the Sheet Curl Radius text box in place of the value that defined the paper curl previously.
Click OK to exit the SheetGroup Properties dialog box.
9.7.4.4. Setting Up the Design Variable for Paper Curl
9.7.4.4.1. To set up the design variable for paper curl:
From the Design Study group in the SubEntity tab, click the Design Variable function.
In the Design Variable List dialog box, click Create.
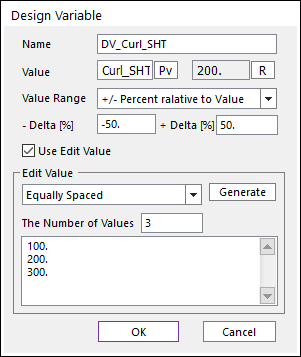
In the Design Variable dialog box, click Pv.
Select the Curl_SHT parametric value and click OK.
Set the name of the design variable to DV_Curl_SHT.
Set the Percent relative to Value to -50% and +50%.
Click Use Edit Value.
Set Edit Value to Equally Spaced and set the number of values in the Values text box to 3.
Click Generate. The values 100, 200, and 300 appear.
Click OK to return to the Design Variable List dialog box.
Make sure the DV_Curl_SHT Design Variable is selected and click OK.
9.7.4.5. Setting Up and Running the Design of Experiments
You will set up and run the design of experiments. You will run nine trials, one for each possible combination of values for the two design variables.
9.7.4.5.1. To set up and run the design of experiments:
Save the RecurDyn model file to a new file name, such as MTT2D_DOE_Curl.rdyn.
On the Analysis tab, in the Simulation Type group, click the Design Study function. The DOE dialog box opens.
In the Design Variable page, click Create Table with DV. You can see that 3 cases are created in the DOE table.
Since there is two design variable and the number of levels is 3, 9 cases are created.
If you click the Performance Index page and check it, you can see that the Performance Index created earlier is applied.
Click Simulate to run the design study.
RecurDyn runs nine simulations.
9.7.4.5.2. To review the results of the design of experiments:
Click Result Sheet page to see a summary of the simulations as shown in the figure on the below.
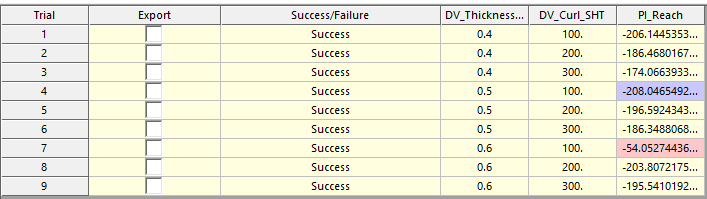
The results show that, in general, the paper sticks out more to the left as the paper thickness increases and as the curl radius decreases (tighter curl). The data for the sheet with a thickness of 0.6 mm and a curl of 100 mm is very different, however. Something dramatic must have happened.
Click OK to exit the DOE dialog box.
Review the animation data (RecurDyn Animation Data contained in files with a .ran file extension) for trials 7 and 8 using the Import command under the File menu.
A set of ran files that have _1 through _9 added to the original file name appear.
Import the file for trial 7 and animate it
Import the file for trial 8 and animate it.
What can you conclude?
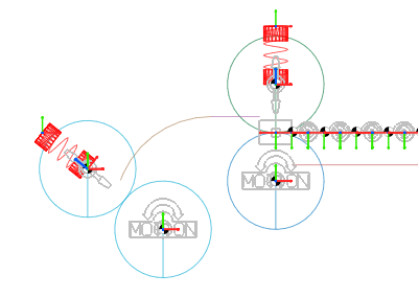
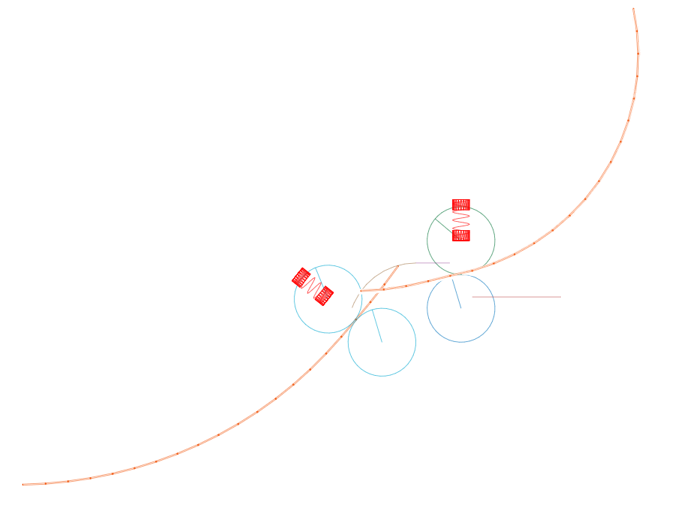
The figure to the below superimposes the final position of trials 7 and 8. You should observe that in trial 7, a combination of a tight curl and thick (stiff) sheet causes the sheet to stub in the corner between the guide and the roller. In all other cases, the sheet is able to go through the second roller pair.
Save the RecurDyn model file with the current results.
9.7.5. Case 3: Design of Experiments with a Moving Guide Assembly
In this chapter, you run a design of experiments that moves the linear and arc guides that guide the sheet between the first and second sets of rollers.
9.7.5.1. Task Objective
You will create parametric points that are needed to control the position of the guides:
A center point controls the position of the arc guide.
Starting and ending points control the position (and size) of the linear guide.
You will define the starting and ending points of the linear guide relative to the center of the arc guide. You will define a marker at the parametric point of the arc guide that will be used as reference for defining the location of the parametric points for the linear guide. You will define the x and y coordinates of the arc guide parametric point by specifying two parametric values. Given the above relationships, you will be able move the arc and linear guides as an assembly by adjusting the values of the two parametric values.
9.7.5.2. Estimated Time to Complete
45 minutes
9.7.5.3. Saving the Model to a New File Name
You will save the model to a new file name because the new setup for this DOE will disturb the previous DOE setup.
9.7.5.3.1. To save the file to a new name:
Use the Save As command under the File menu to save the RecurDyn model file to a new file name, such as MTT2D_DOE_Move.rdyn.
9.7.5.4. Defining Parametric Points
You will create a parametric point, called PP_ArcGuide, which acts as the reference point for two other parametric points, a marker, the arc guide, and the linear guide.
9.7.5.4.1. To define the parametric points:
From the Parameter group in the SubEntity tab, click the Parametric Point function.
Click Add in the Parametric Point List window.
Define a parametric point named PP_ArcGuide located at -30, 95, 0 or the center of the arc guide.
Click Apply.
From the Professional tab of the Marker and Body group, click the Marker function to define a marker that is on the Mother Body and located at the PP_ArcGuide parametric point.
Display the Properties dialog box for the marker and check the origin definition. You should see the name PP_ArcGuide in the Origin text box under the Origin & Orientation page.
Tip
If you see a set of numbers, click Pt and select the PP_ArcGuide icon in the modeling window. Do this until the parametric point name appears in the origin text box. Click OK to close the Marker Properties dialog box
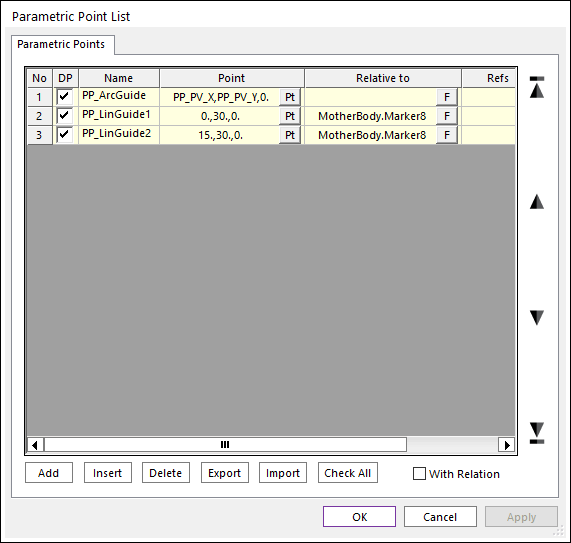
Define two additional parametric points as shown in the figure on the below. Define them relative to the marker that you just created by clicking F and selecting the marker located at the PP_ArcGuide parametric point.
The values in the Point text box are the relative coordinates from the center of the arc guide to the starting and ending points of the linear guide.
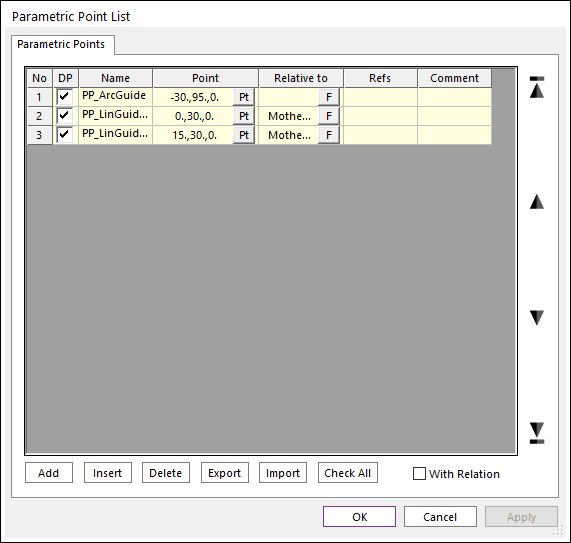
Click OK to exit the Parametric Point List dialog box. You should see three Parametric Point icons.
9.7.5.5. Add the Parametric Points to the Guide Definitions
You will the guide definitions to include the parametric points. The parametric points will define the location of the guides.
Display the Properties dialog box for the arc guide (GuideArc1), click Pt for the Center Point of the arc guide, and click the PP_ArcGuide parametric point. The text box for the Center Point of the arc guide should now contain the name, PP_ArcGuide, as shown in the figure to the below.
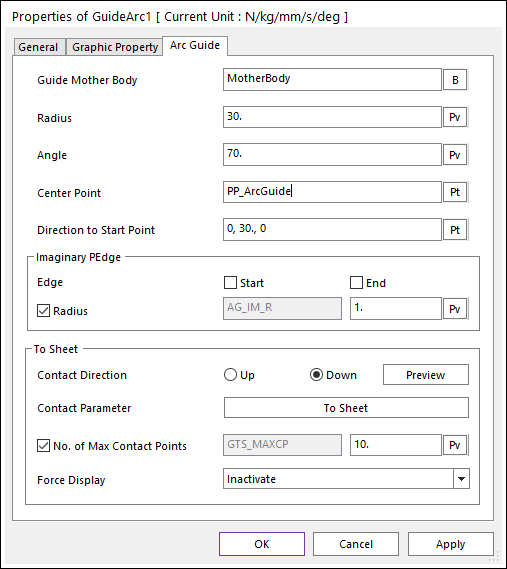
Click OK to exit the Arc Guide dialog box.
Display the Properties dialog box for the linear guide located next to the arc guide (GuideLinear2), and then:
In the Linear Guide page, click Pt for the Start Point of the guide, and click parametric point PP_LinGuide2 (located at the right side of the guide).
Repeat the same step for the End Point of the guide and click parametric point PP_LinGuide1 (located at the left side of the guide).
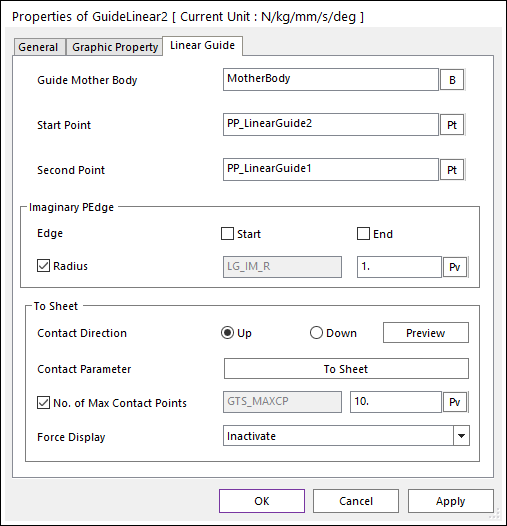
The names of the parametric points should appear in the text boxes for the Start Point and Second point, as shown in the figure to the below.
Click OK to exit the Linear Guide dialog box.
9.7.5.5.1. To test the parametric points:
Select the PP_ArcGuide parametric point.
Use the Basic Object Control dialog box to move the point back and forth 10 mm in the x and y directions. Check that all three parametric points, the marker, and both guides move together.
If not, review the definition procedure and get help as needed until the objects move together. Make sure the PP_ArcGuide parametric point is left in its original position.
9.7.5.6. Creating Parametric Values to Control Location of the Assembly
You will create two parametric values to represent the x and y location of the parametric point.
9.7.5.6.1. To create parametric values:
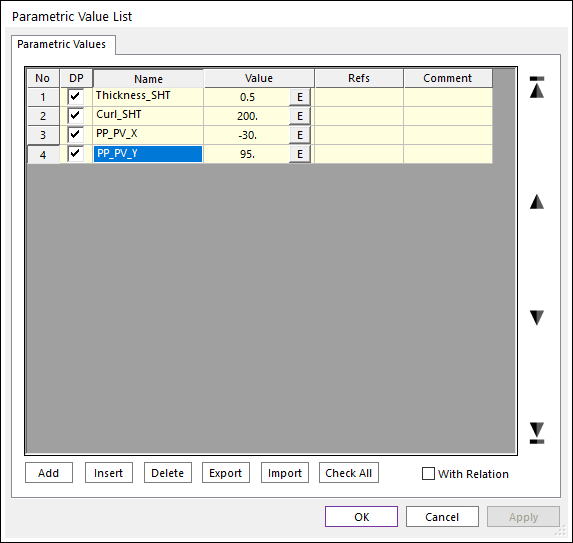
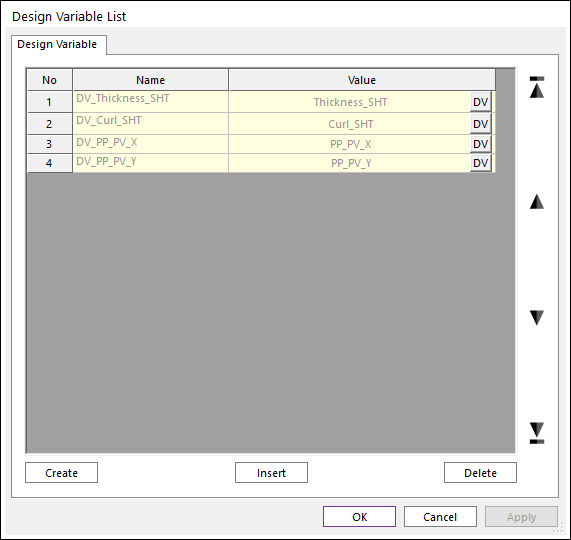
Create two new parametric values to represent the x and y location of the parametric point as shown in the figure on the below (from the Subentity tab, click the Parametric Value function).
Display the Parametric Points dialog box (from the Subentity menu, click the Parametric Point function).
Manually enter the parametric values into the Point text box of the PP_ArcGuide parametric point as shown in the figure on the below.
9.7.5.7. Setting Up and Running the Design of Experiments
Now you will create design variables for the two parametric values you created in the previous section that control the position of the guide assembly. You will then set up and run the design of experiments.
9.7.5.7.1. To add the design variables and set up and run the design of experiments:
Add a design variable to the Design Variable dialog box (as shown in the figure on the below) for each of the new parametric values. For each design variable, set:
Value Range to +/- Delta relative to Value
-Delta to -4 and the +Delta to 4
Click OK to exit the Design Variable List dialog box.
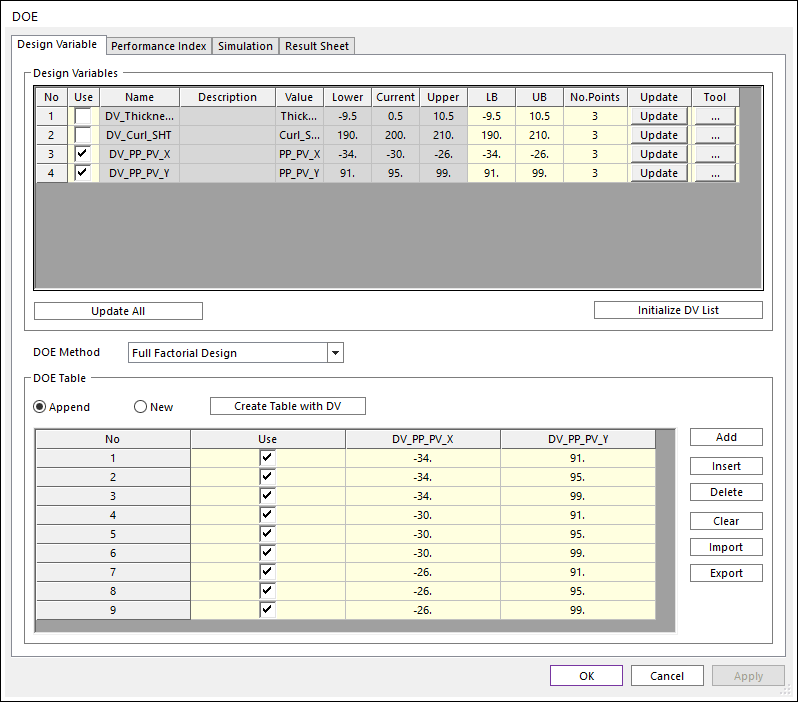
In the DOE dialog box, select two new design variables for this study as design variables. Uncheck the Use button of the unused design variables DV_Thickness_Sht and DV_Curl_SHT. The design variable part of the window is shown as shown in the figure on the below. Do the following.
In the Design Variable page, click Create Table with DV. You can see that 9 cases are created in the DOE table.
On the Simulation page, click Simulate to run the design of the experiment. Analysis 9 times.
You will see the arc guide and linear guide move to different position in the graphics window as the various trials are run. RecurDyn runs nine simulations, one for each value of the variables. Remember that the sheet will have the nominal curl of 200 mm that you set up in Case 2.
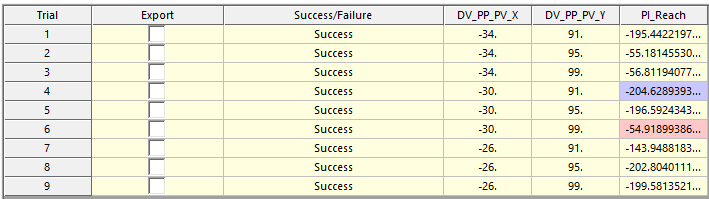
In the DOE dialog box, click Result Sheet to see a summary of the simulations as shown in the figure on the below. The largest reach is with trial 4, where the guide is lowered from the original position. The lowest reach is for trial 6, and it appears that the sheet may not have been able to pass through both rollers. You will look at the animation for trial 6 in the next section.
9.7.5.8. Reviewing the Results of the Design of Experiments
The review of the animation results for this DOE is different than the review of the previous DOE and design study because the model has a changing geometric configuration for the various trials. You will get a confusing animation if you display the various trials without adjusting the parametric values such that the guides are in the correct position. You will see the sheet follow along the guides in a different position that the guides being displayed. RecurDyn includes a feature that allows you to adjust the parameters efficiently before displaying the results of a trial.
9.7.5.8.1. To view the animations for trial 6:
As shown in the figure below, Trial No. in the Result Sheet page. Enter 6 in and click Update Current Model.

Click Close to close the Result Sheet window.
Click OK in the Design Study window and you will see the guides move from their nominal position to the position used in Trial 6.
Click on the Import option in the File menu, set the File Type to RecurDyn Solver-Generated animation data (.ran files) and select the file named MTT2D_DOE_Move_6.ran.
You will see that the sheet is caught in the corner between the arc guide and the movable roller in the second roller pair. That explains the low reach value of the sheet for trial 6.
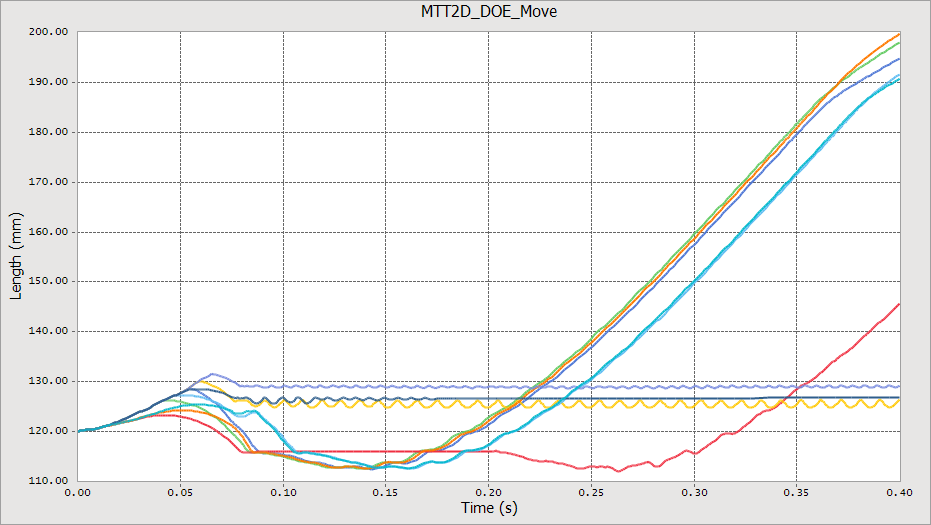
9.7.5.8.2. To plot a family of curves for all of the trials:
Display the plot window and import the results for all of the trials (MTT2D_DOE_Move_*.rplt files) other than trial 6 (already loaded in the plot window).
(Under the Bodies category, expand SheetBody1, right-click on Pos_TM and select Multi Draw). The Multi Draw command will plot that output for all output cases that have been imported into the plot window. The figure below shows the results of plotting the magnitude of the translation of the first segment of the sheet.