5.5.2.3. Result data
After Frequency Response Analysis, the user can get a text file as *.out file that reports state matrix (A,B,C,D) of system and the magnitude and phase angle at a given frequency.
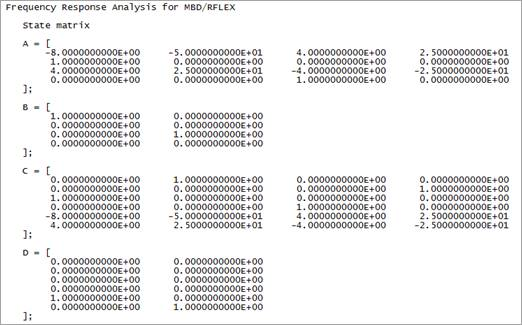
Figure 5.44 State matrix in OUT file.
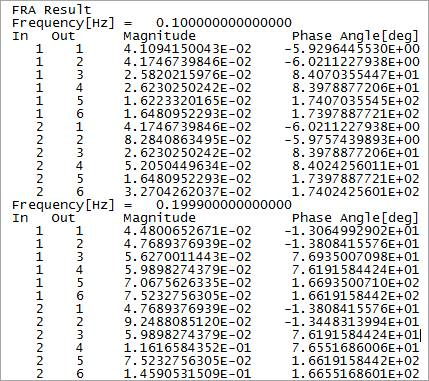
Figure 5.45 Magnitude and Phase Angle in OUT file