7.2.1.6.4. Color Map and Surface Contour
Color Map and Surface Contour
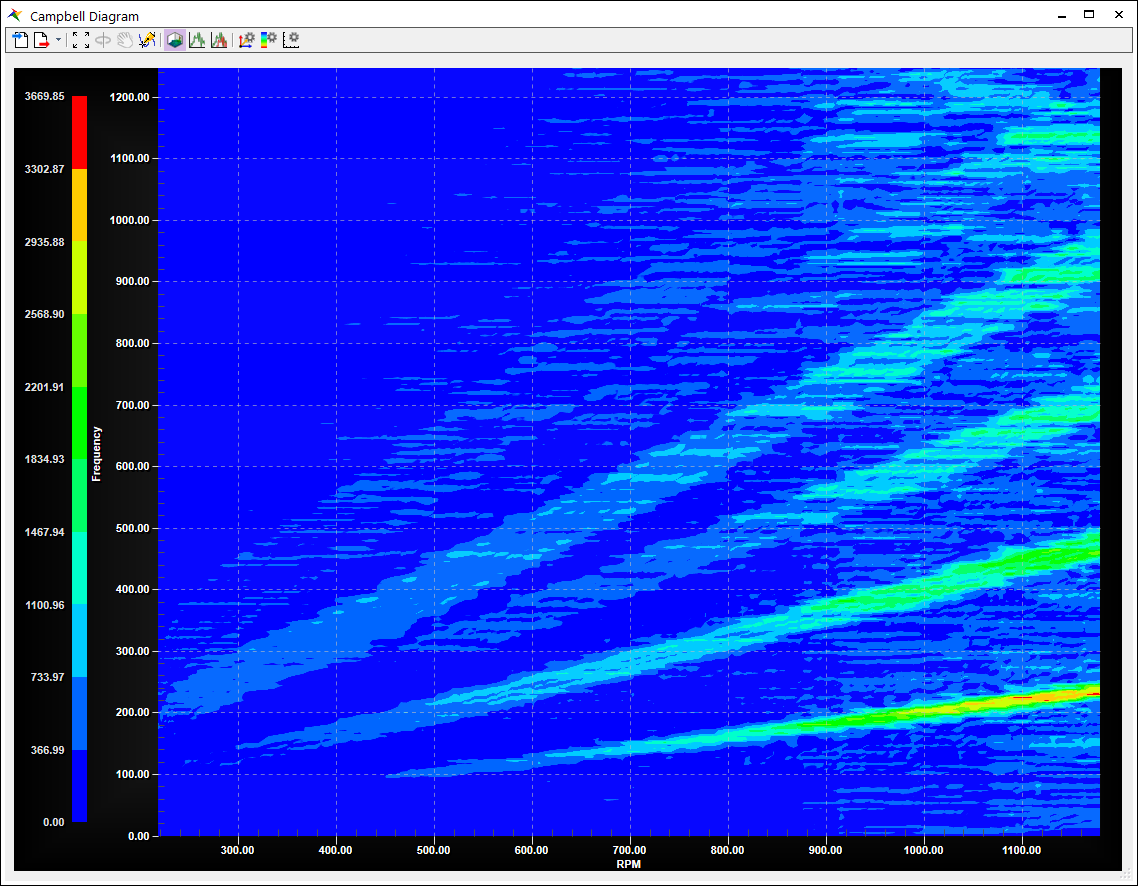
Figure 7.64 Color Map
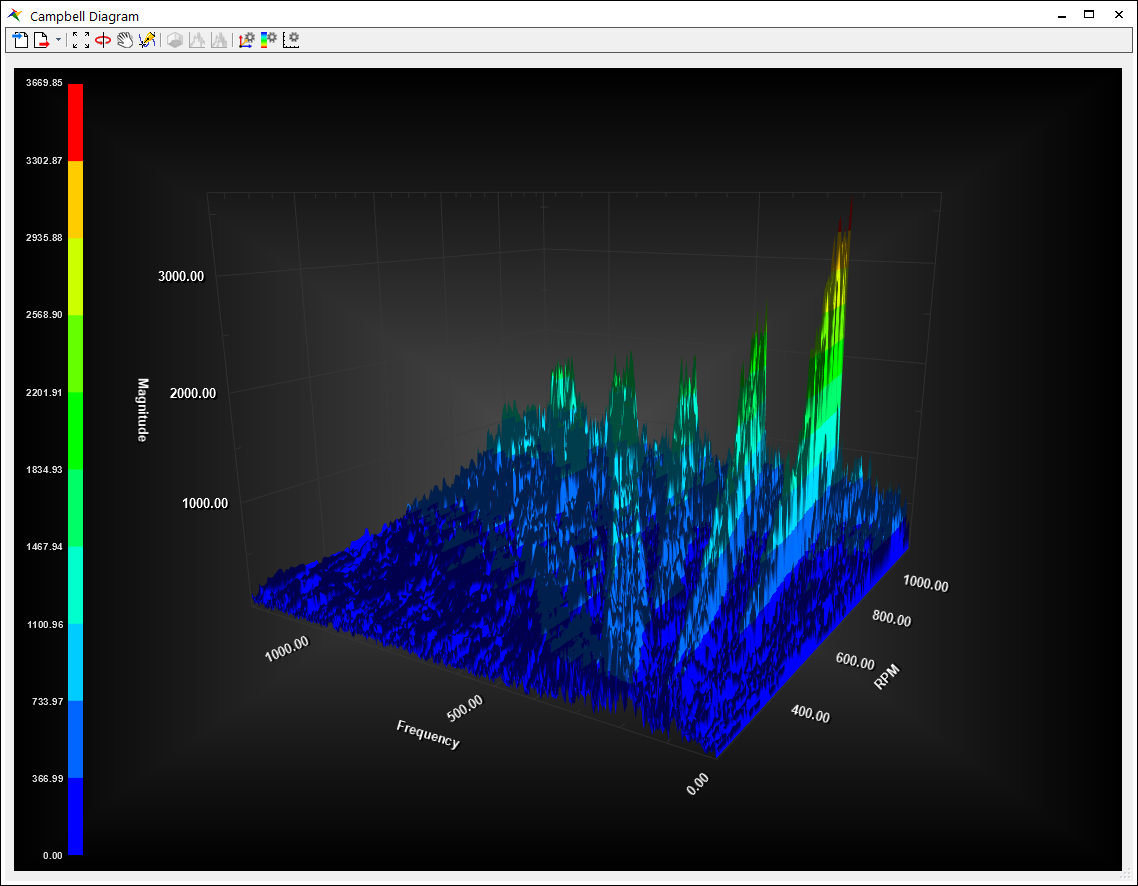
Figure 7.65 Surface Contour
Toolbar
Color Map and Surface Contour toolbar support various features.
Import File: It is used to import 3D data file (*.csv). Usually exported from its dialog.
Export Files: It is used to export 3D data file (*.csv).
Export Image (Clipboard): It is used to copy an image of color map to the clipboard.
Export Image (Setting): It is used to make image file of color map.
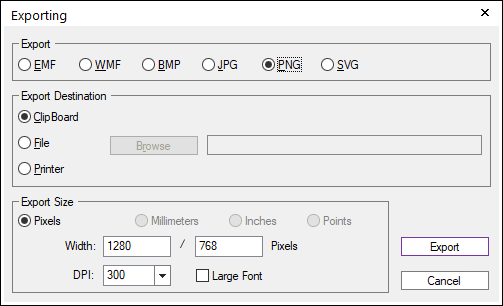
Figure 7.66 Export Image
Initialize View (F): It initialize the view status such as zoom. In case of Surface Contour, translate, and light control.
Rotate View: It is Surface Contour option. When this option is toggled on, the surface contour slowly rotates. It can be used to demonstrate general view of the surface contour.
Translate View(T): It is Surface Contour option. When this option is toggled on, mouse drag operation is changed to translate view. Default mouse-drag operation is rotate.
Trace Data: It traces the RPM, Frequency, Magnitude data from the location of mouse pointer.
Section View: It is Color Map option. It enables the section view of X and Y-Axis and section view option. With Trace Data option toggled, clicking the color map updates the X, Y-sections. In the Section View, the Phase-angle [Degree] results are shown in each section line.
Align to Order Line: It shows a order line in the RPM-Frequency section view. This option is only enable in the RPM-Frequency section view.
Show Section Lines: It specifies whether to toggle the section line.
Zoom: It specifies the mouse operation in section view plot. Dragging in the section view plot operates as Zoom.
Data Trace: It specifies the mouse operation in section view plot. It traces the data from the location of mouse pointer.
Fit: It initialize the view status such as zoom.
Order Line (Vold-Kalman Filter): It shows the second generation Vold-Kalman Filter result which is an order tracking algorithm based on bandwidth pass filter. It is only enabled in the RPM-Order Section View. If the check box is checked, then the RPM-Magnitude and Phase angle plots are the Vold-Kalman Filter result (X axis: the reference rotational velocity [RPM], Y axis: The Magnitude and Phase of Vold-Kalman Filter result). If the check box is unchecked, then the RPM-Magnitude and Phase angle plots are interpolation result of the 2D map. For more information, refer to the Vold-Kalman Filter.
Frequency Bandwidth: It is a bandwidth option of the Vold-Kalman Filter. The default value is set to 1.0/(End Time - Start Time). The bandwidth value should be positive real number.
VK Weighting Factor: It is the Vold-Kalman Filter weighting factor. The relation of the Frequency Bandwidth (bw) and the VK Weighting Factor(r) is approximated to below equation. The factor value should be positive real number.
2-Pole: \({{b}_{w}}=\frac{{{f}_{s}}}{2\pi }(1.58{{r}^{-0.5}})\)
3-Pole: \({{b}_{w}}=\frac{{{f}_{s}}}{2\pi }(1.70{{r}^{-1.0/3.0}})\)
Where, \(f_s\) is the Sampling Frequency of the Campbell source data.
[Christian2000]Christian Feldbauer, Robert Holdrich, “Realization of a Vold-Kalman Tracking Filter - A Least Squares Problem”, Proceedings of the COST G-6 Conference on Digital Audio Effects (DAFX-00), Verona, Italy, December 7-9, 2000)
If the radio button is checked to the VK Weighting Factor, then the user-input VK Weighting Factor is directly used for computing the Vold-Kalman Filter. If the radio button is checked to the Frequency Bandwidth, then the solver calculates the Vold-Kalman Weighting Factor using above equation and use it.
Note
The maximum diagonal value of the assemble matrix is defined as the following value for the Vold-Kalman Filter formulation.The assemble matrix : \({r^2}{{\bf{A}}^T}{\bf{A}} + {\bf{I}}\)2-Pole maximum diagonal value in the assemble matrix : \({({6}{r}^{2}+1)}_{ii}\)3-Pole maximum diagonal value in the assemble matrix : \({({20}{r}^{2}+1)}_{ii}\)In order to keep the effect of the additional unity value(1.0), the VK Filter Weighting Factor (r) should be limited to lower than the following maximum value. If the VK Filter Weighting Factor is greater than the maximum value, then the unity effect is lost by the numerical rounding-off error.2-Pole VK Weighing Factor maximum value : 4.0e+63-Pole VK Weighing Factor maximum value : 2.0e+6Number of Poles: It can be select the number of poles of the Vold-Kalman Filter. 2 and 3 Poles are available. Default is 2-pole option.
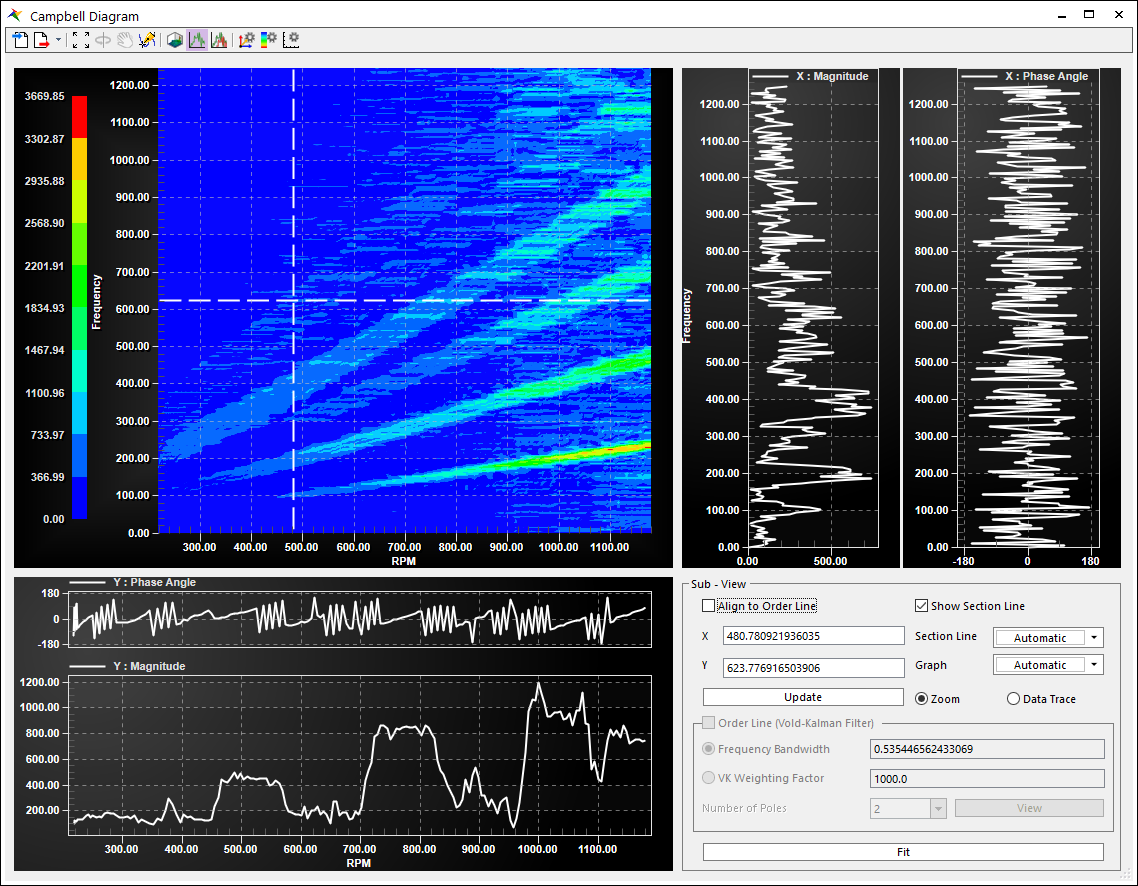
Figure 7.67 Section View for the RPM-Frequency
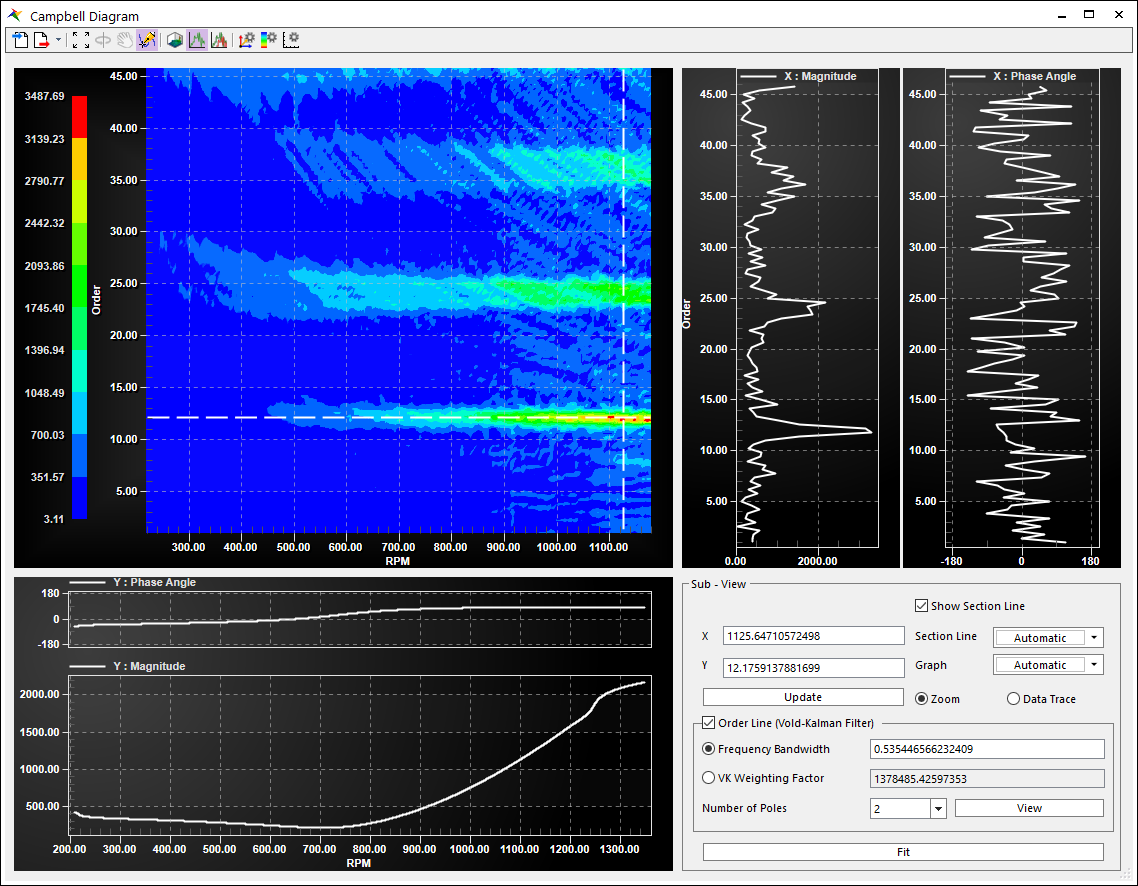
Figure 7.68 Section View for the RPM-Order
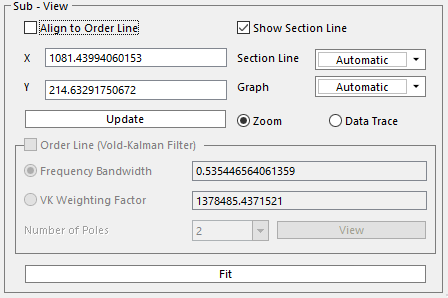
Figure 7.69 Section View options
Slice View: It shows multiple lines. When the RPM-Frequency plot is selected, the multiple lines are determined as the Start Freq., End Freq., and Gap options. When the RPM-Order plot is selected, the multiple lines are determined as the order lines in the Plot page in the Campbell Diagram dialog.
Start Freq.: A frequency of the first line. This option is only enable in the RPM-Frequency.
End Freq.: It defines maximum frequency of multiple lines. This option is only enable in the RPM-Frequency.
Gap: A gap frequency of the multiple lines. The numer of lines = {(End Freq - Start Freq)/Gap + 1}. This option is only enable in the RPM-Frequency.
Show Section Line: It shows the multiple lines. This option is only enable in the RPM-Frequency.
Sectin Line Color: It can be set a color of the mulitple line. This option is only enable in the RPM-Frequency.
Section Curve: If this check box is checked, then the user can select some lines. And the selected lines are highright in the below plot plane.
Draw Overall: It shows the overall order line. The overall line is a summation of all order lines. \(\sum m\) This option is only enable in the RPM-Order.
Update button: It draws again the multiple lines. This option is only enable in the RPM-Frequency.
Zoom: It specifies the mouse operation in section view plot.Dragging in the section view plot operates as Zoom. It enables when the Select Curve is not checked.
Data Trace: It specifies the mouse operation in section view plot. It traces the data from the location of mouse pointer. It enables when the Select Curve is not checked.
Fit button: It initialize the view status such as zoom.
Order Line(Vold-Kalman Filter): It shows Vold-Kalman multiorder tracking filter results for the order lines.
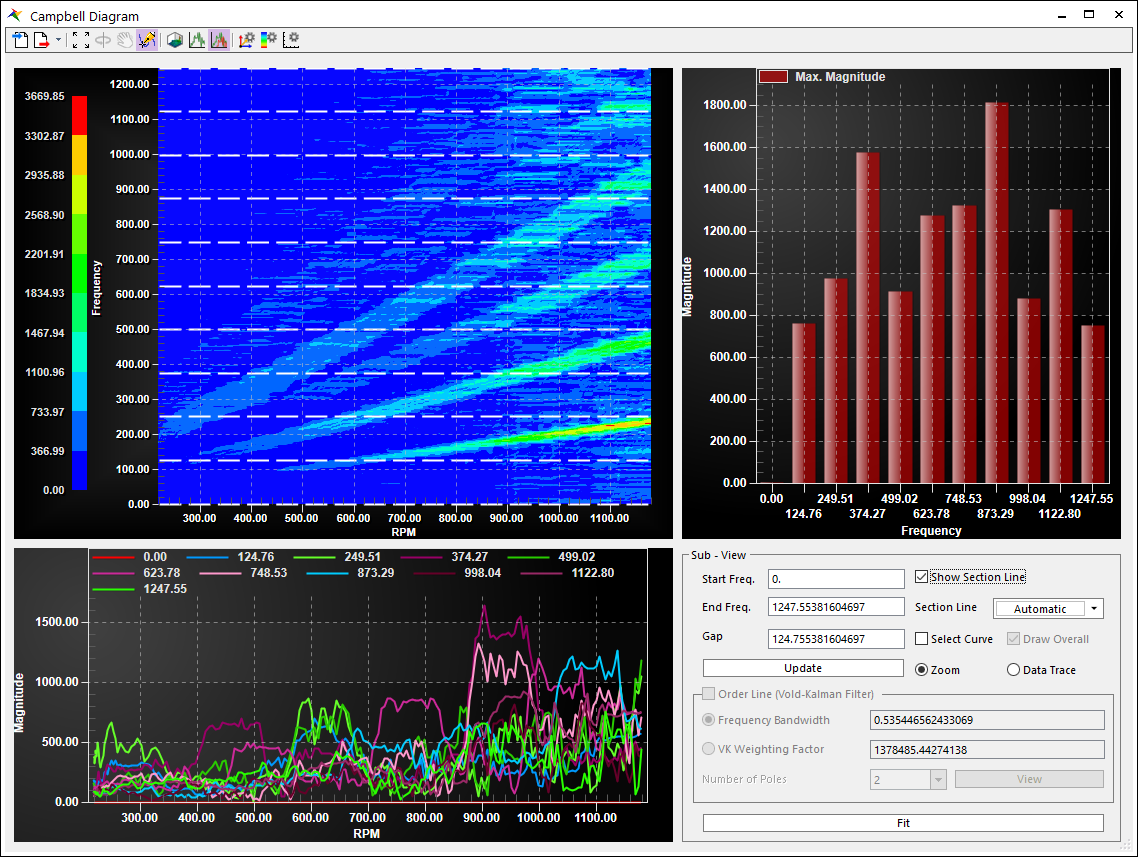
Figure 7.70 Slice View for the RPM-Frequency
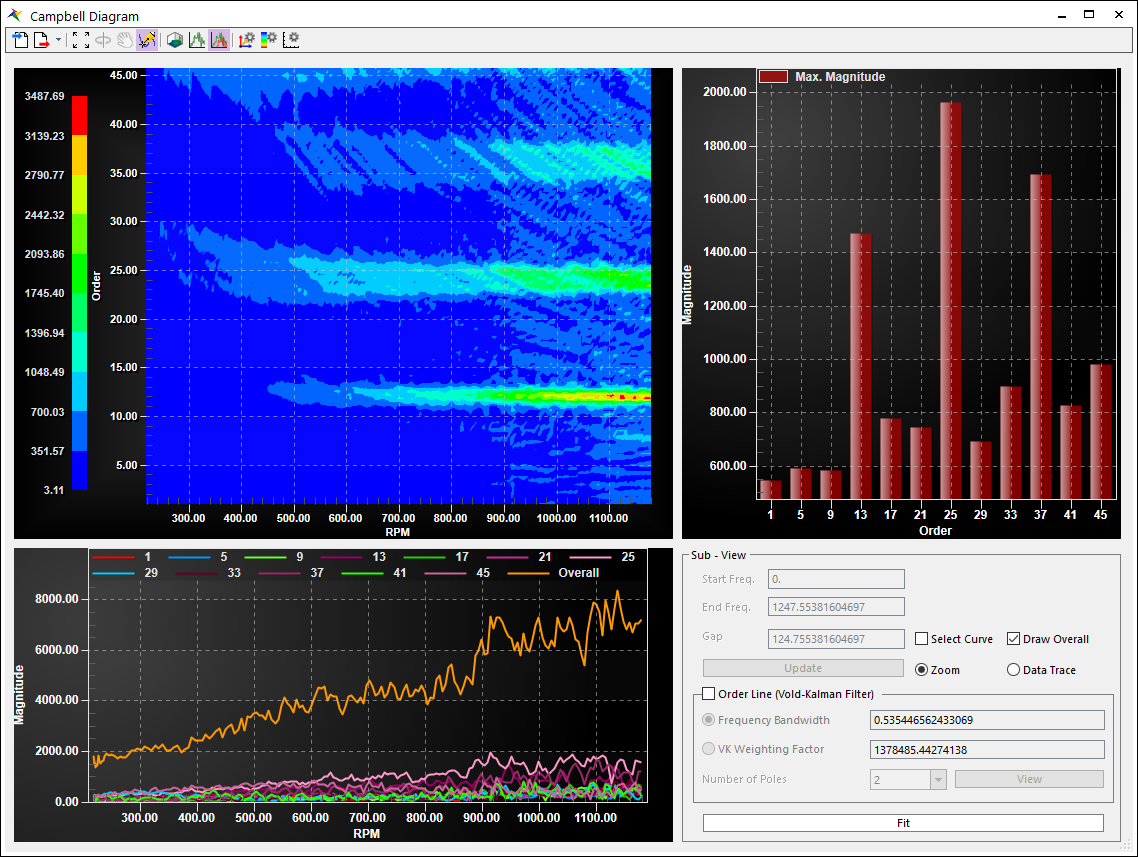
Figure 7.71 Slice View for the RPM-Order
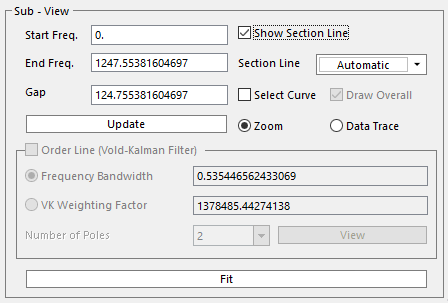
Figure 7.72 Slice View options
Note
Clicking the mouse right-click on Color Map or Section View or Slice View shows the pop-up menu. In Color Map, it supports Viewing Style and Plotting Method. In Section View, it supports Viewing Style, Plotting Method, Mark Data Points and Add to Plot.
Axes Setting: It specifies the settings of X, Y and Z-Axes. In case of Color Map, Z-Axis cannot be modified. In case of Surface Contour, Z-Axis can be modified.
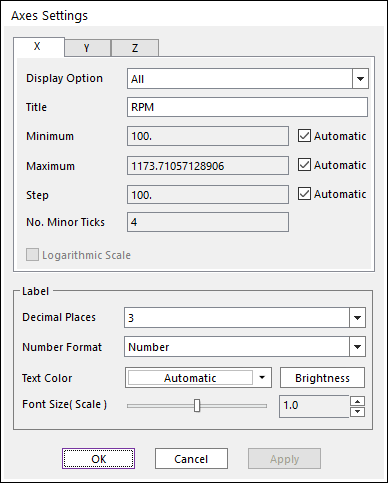
Figure 7.73 Axes Settings dialog box
Display Option: It specifies how to display the axis data. It supports All, Grid Lines and Axis Title, Grid Lines and Grid Numbers, Grid Only, Axis Title Only, None.
Title: It is used to change the title of axis.
Minimum: It specifies the minimum value of axis. To customize its value, uncheck the Automatic option.
Maximum: It specifies the maximum value of axis. To customize its value, uncheck the Automatic option.
Step: It specifies the step of the grid line of axis. To customize its value, uncheck the Automatic option.
No. of Minor Ticks: It specifies the number of ticks between the steps. Unchecking the Automatic option in Step activates this option.
Logarithmic Scale: It specifies whether to use Logarithmic scale. It can be activated in Z-Axis which is magnitude of the graph.
Decimal Places: It specifies the decimal places of axes. It supports decimal places of 1 ~ 7.
Number Format: It specifies the number format of axes. It supports the Number and Scientific.
Text Color: It specifies the text color of axes.
Brightness: It specifies the brightness of text of axes. It supports numbers between 0 ~ 255 (brightest).
Font Size (Scale): It specifies the font size of axes.
Contour Legend
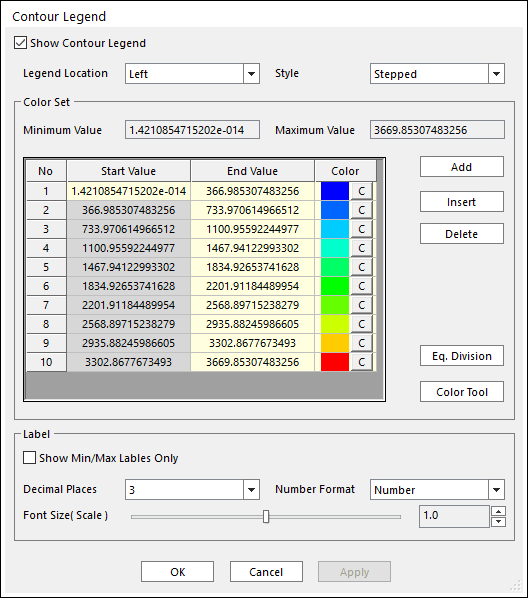
Figure 7.74 Contour Legend dialog box
Show Contour Legend: It specifies whether to show contour legend.
Legend Location: It specifies the location of legend. It supports top, bottom, left and right.
Style: It specifies the style of contour. It supports stepped or smooth.
Eq. Division: It is used to automatically distribute values evenly according to the number of rows.
Color Tool: It is used to set the minimum and maximum color and values of contour.
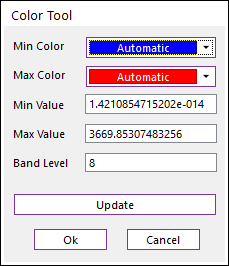
Figure 7.75 Color Tool
Setting
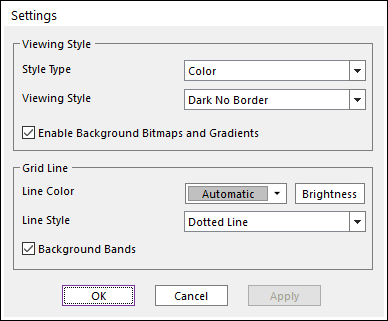
Figure 7.76 Settings dialog box
Style Type: It specifies the style type of color map. It supports Color, Monochrome, Monochrome + Symbol.
Viewing Style: It specifies the viewing style of color map. It supports Light Inset, Light Shadow, Light Line, Light No Border, Medium Inset, Medium Shadow, Medium Line, Medium No Border, Dark Inset, Dark Shadow, Dark Line, Dark No Border
Enable Background Bitmaps and Gradients: It specifies whether to enable background bitmaps and gradients.
Line Color: It specifies the color of grid lines.
Line Style: It specifies the style of grid lines. It supports Thin Solid Lines, Thick Solid Line, Dotted Line, Dashed Line.
Background Bands: It specifies whether to use background bands. It sets slightly dark area in grid steps alternately. In case of Surface Contour, it is disabled.
Note
Clicking the mouse right-click on Surface Contour shows the pop-up menu. In surface contour, it supports Viewing Style, Wireframe, Plotting Method and 2D Contour.