21.2.3.4. Design Optimization
AutoDesign provides the meta-model based optimization methods. The detailed theory is explained in the Basic Theory for AutoDesign. Design Optimization provides 6 DOE methods for meta-model construction. Also, it supports 4 meta-model methods that include 7 polynomial functions. For easy use, AutoDesign provides a good default options for them. For the guideline for them, one can refer to Guideline.
21.2.3.4.1. Run Step of Design Optimization
Select the Optimization icon of the Optimization group in the AutoDesign tab.
Figure 21.40 Optimization icon of the Optimization group in the AutoDesign tab
Define design variables
Check design variables in Design Variable tab of the Design Optimization dialog and select design variable type and value. For the usage of design variable types, one may refer to Guides for Design Variables and Constants.
Variable type: Design variable is defined and changed as a value between lower and upper bound during AutoDesign process
Constant type: Design variable is defined as a constant value. Some case user wants to settle down a design variable as a constant value because of design constraints or change of design direction during Design process. For this case, the value section of list is active, and one can write the constant value of design variable.
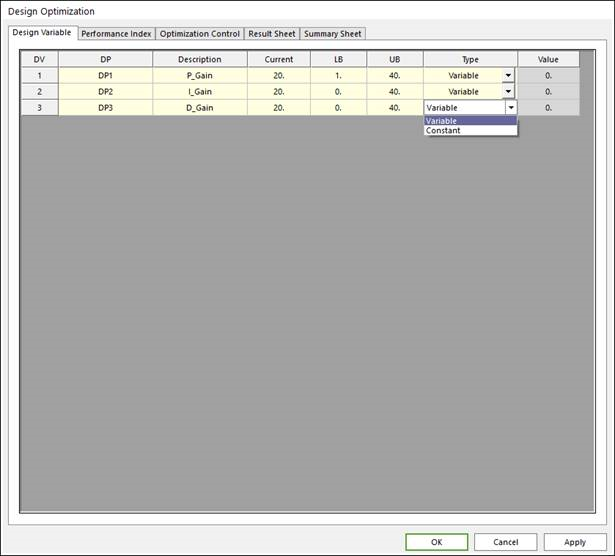
Figure 21.41 Design Variable tab of the Design Optimization dialog box
Formulate design optimization problem
First, Click the Add button, and select an analysis response from full down list of AR section. Next, select Definition and the Goal type and modify the Weight/Limit Value.
Objective function: Select definition type as Objective, and goal type as Min or Max. Next, define the weight value in Weight/Limit Value section. For example, selecting Min goal type and writing 10 in Weight/Limit Value section means minimization about that performance index with 10 weight value.
Constraint condition: Select definition type as Constraint, and goal type as LE or GE or EQ. Next, define the limit value in Weight/Limit Value section. For example, selecting EQ goal type and writing 0.0 in Weight/Limit Value section means the constraint condition of that performance index is that the selected performance equals zero.
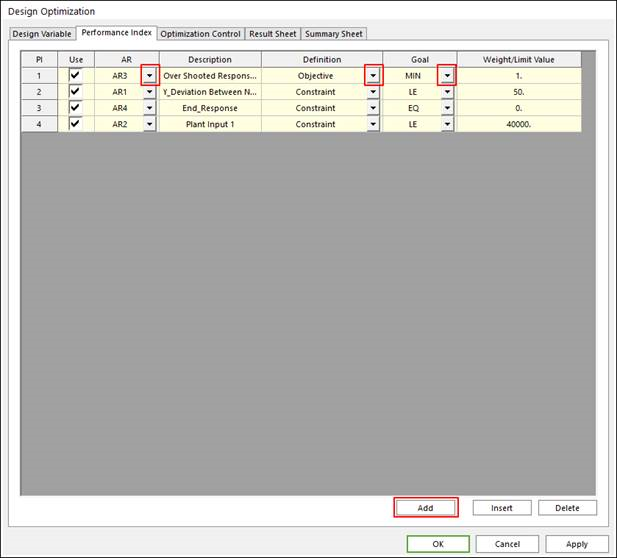
Figure 21.42 Performance Index tab of the Design Optimization dialog box
Select DOE and Meta modeling method, and polynomial function type.
The theoretical explanation of each DOE method and meta modeling technique is explained in Basic Theory. For the guideline for selecting DOE method, one may refer to Guides for the initial Sampling Method. of Guideline.
Number of Trials: This number is the summation the initial trial, which the current design variables are applied on, and the number of DOE trial. The number of DOE trial is automatically calculated from the selected DOE method.
Get from simulation history: If one wants to use the result history data of former AutoDesign process, check the check box and click the Get from History button. Then the simulation history dialogue is opened, and user can select the useful cases shown in Figure 21.44. The checked cases in the check box of Import section is applied on the current process, but the selected case has the same number of design variable and performance indices as the current design problem.
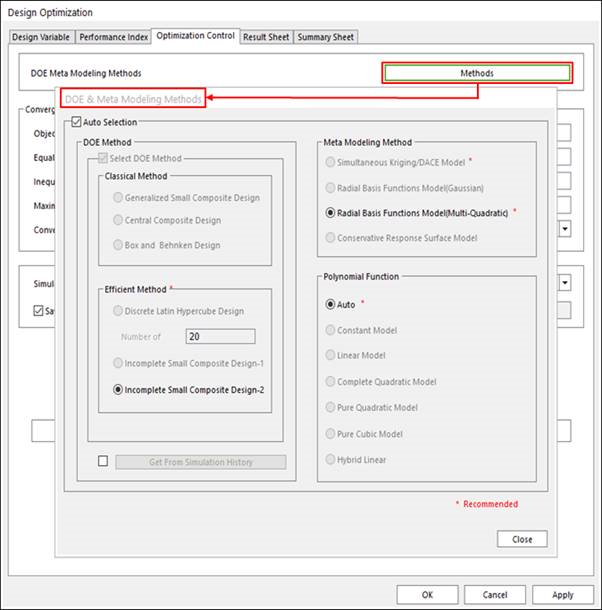
Figure 21.43 Select Method Options
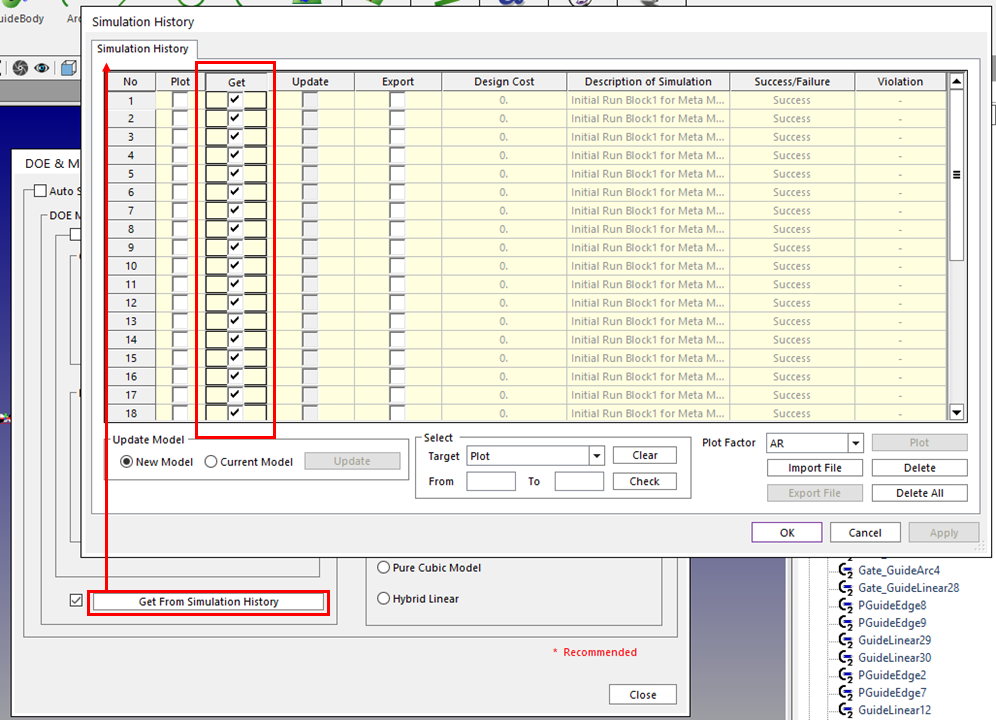
Figure 21.44 Select applied result in simulation history list
Run optimization
Define convergence tolerance and run optimization. The run process is same as the case of design study process.
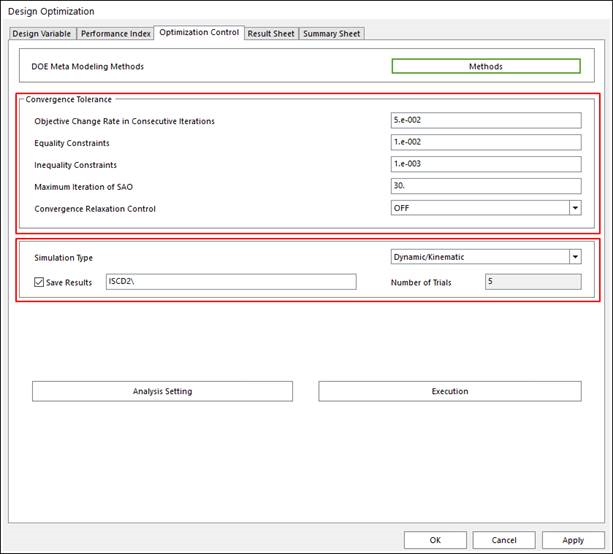
Figure 21.45 Optimization Control tab of the Design Optimization dialog box
Convergence Tolerance: Each tolerance is defined convergence condition for objective function, equality and inequality constraint. The Maximum Iteration of SAO can define the limit of trial in the SAO process. The guide for defining the convergence tolerance is explained in Guides for Convergence Tolerance.
21.2.3.4.2. Result Sheet of Design Optimization
In Result Sheet page, user can know the convergence history from the plotted curve. From the Optimization History of AR Values list, user can check the performance index results of each trial of optimization process.
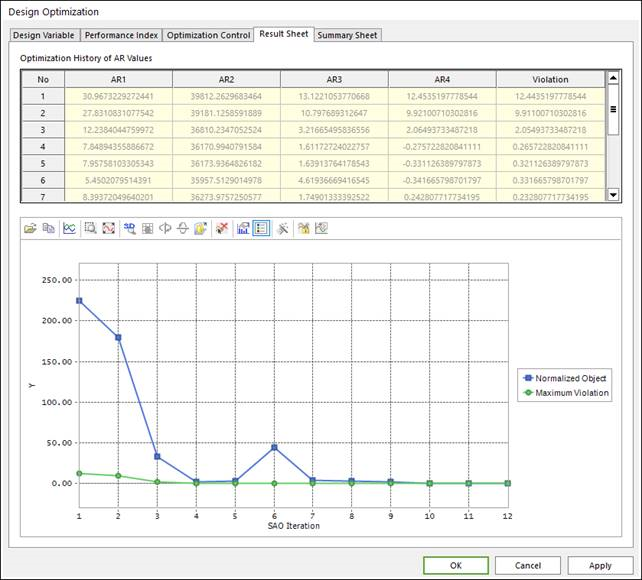
Figure 21.46 Result Sheet tab of the Design Optimization dialog box
21.2.3.4.3. Summary Sheet of Design Optimization
When the optimization is progressed, RecurDyn does not evaluate the same design values among the previous runs. This can save the computational time but make the final design results.
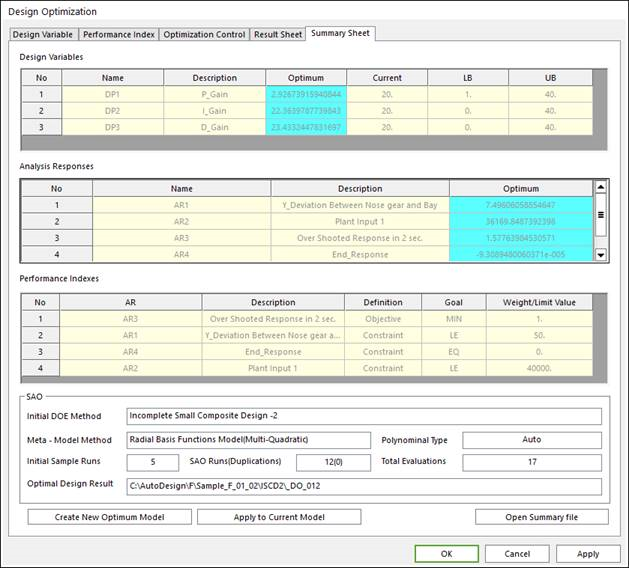
Figure 21.47 Typical form of summary sheet
The summary sheet shows the optimum values of design variables and analysis responses. Also, the design optimization formulation is listed. Especially, it summarizes the SAO process, which includes DOE method, Meta-model method and total evaluations. Finally, it shows the analysis result file for the optimum design.