7.1.7. Multiple Axes
If the user draws plot data with other units, RecurDyn/Plot supports Multi Axis by default. So, simply drawing plot data with other units becomes multi axis automatically.
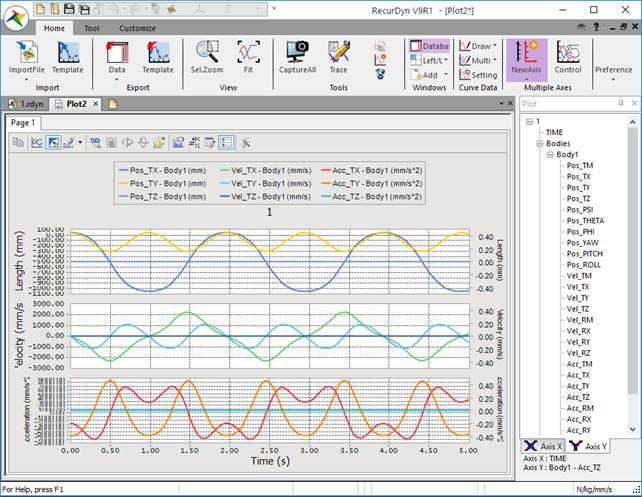
Figure 7.34 Draw with Multi Axis
7.1.7.1. At Current Axis
If this option is checked, the plot data is drawn at the current axis without the unit.
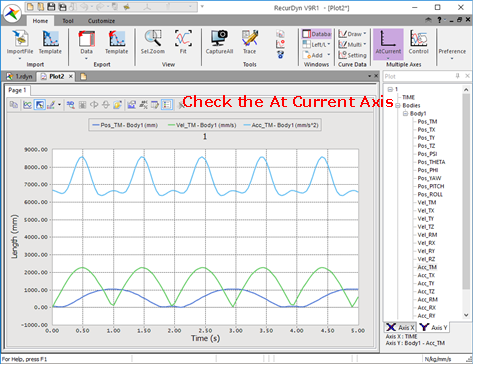
Figure 7.35 Draw at the Current Axis
Note
When the user draws plot data with no unit such as User Data or Request, select an axis drawn and then draw.
7.1.7.2. With New Pane
If this option is checked, the user can draw plot data on the new pane.
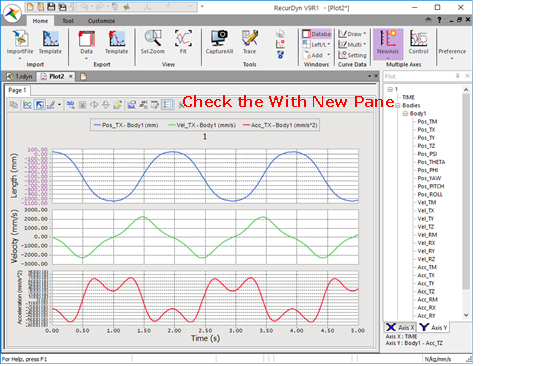
Figure 7.36 Draw with Multi Pane
Delete: When the curve is removed, the pane of drawn curve is deleted together.
Edit: If the user wants to draw by selecting a pane, selects an axis that belongs the pane.
7.1.7.3. With Same Scale
If this option is checked, the user wants to draw plot data with the same unit on the same axis. (The default is checked.)
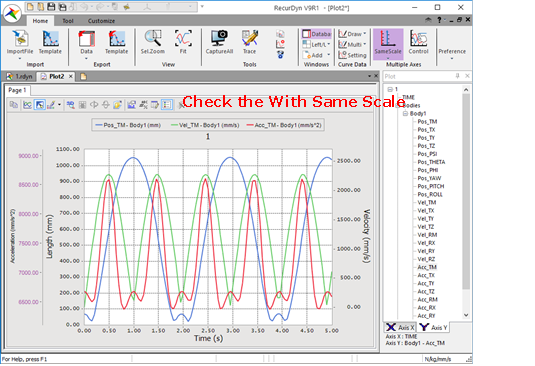
Figure 7.37 Draw with Same Scale
7.1.7.4. With New Axis
If this option is checked, the user can draw plot data on the new axis.
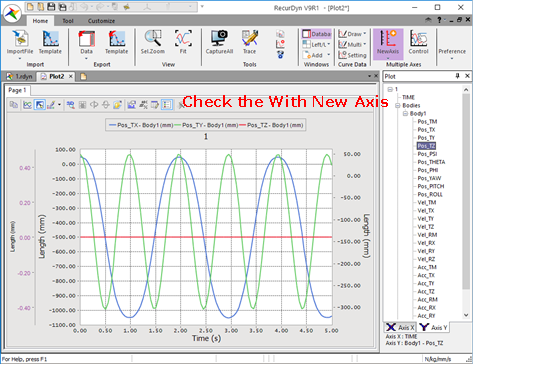
Figure 7.38 Draw with Same Scale
7.1.7.5. Axes Control
The user can change an axis position or a pane. The user must draw plot data before using this function.
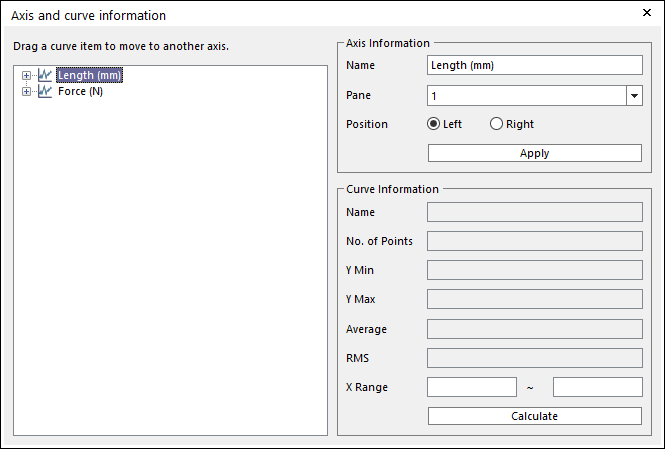
Figure 7.39 Axis and curve information
Step to move curve from its own axis to another
Select the curve item you want to move.
Drag the item to target axis and drop.
If you drop to empty space of tree control, the chart creates an axis and move curve to the new one.
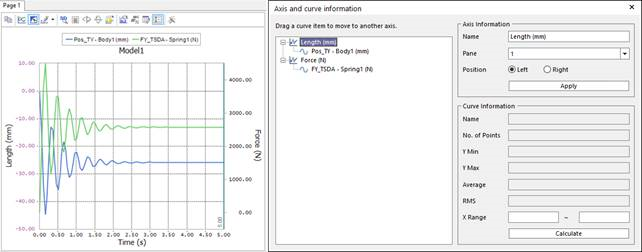
Figure 7.40 Combining two curves to one axis by Drag & Drop function
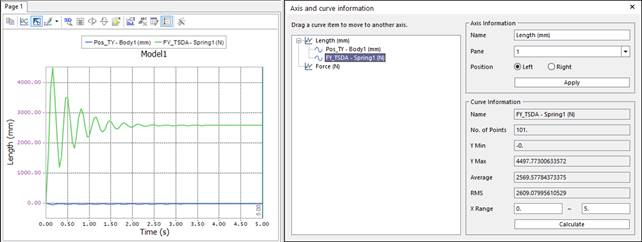
Figure 7.41 Dividing curves to different axes by Drag & Drop function