13.1.3. Component Meta Model
Component Meta Model (CMM) is created using the defined Component Group. The user inputs the degree of freedom (DOF) for each interface marker and the range of each DOF. DOE cases with factorial design are generated based on it. Then, static analysis is performed on the DOE cases. Finally, meta model file (CMM) is built based on the result table (DOE cases + response data) automatically. Meta model file can be applied to Component Geoup.
Note
Each DOF is defined based on the relative positions and orientation of each of the remaining interface markers with respect to the first interface marker (reference marker). Through this definition, all deformation states according to the change of the interface point of the fflex body replaced by the component group can be expressed.
13.1.3.1. Modeling Options
The User select the Component Group defined on the model and create CMM using the dialog box that appears.
Group
Group: Selects a Component Group using Component Meta Model.
13.1.3.2. The process of creating a Component Meat Model
Component analysis and Creating Component Meta Model proceed through the ComponentGroup dialog that appears when you select a Component Group during the modeling process.
13.1.3.2.1. Component Variable Page
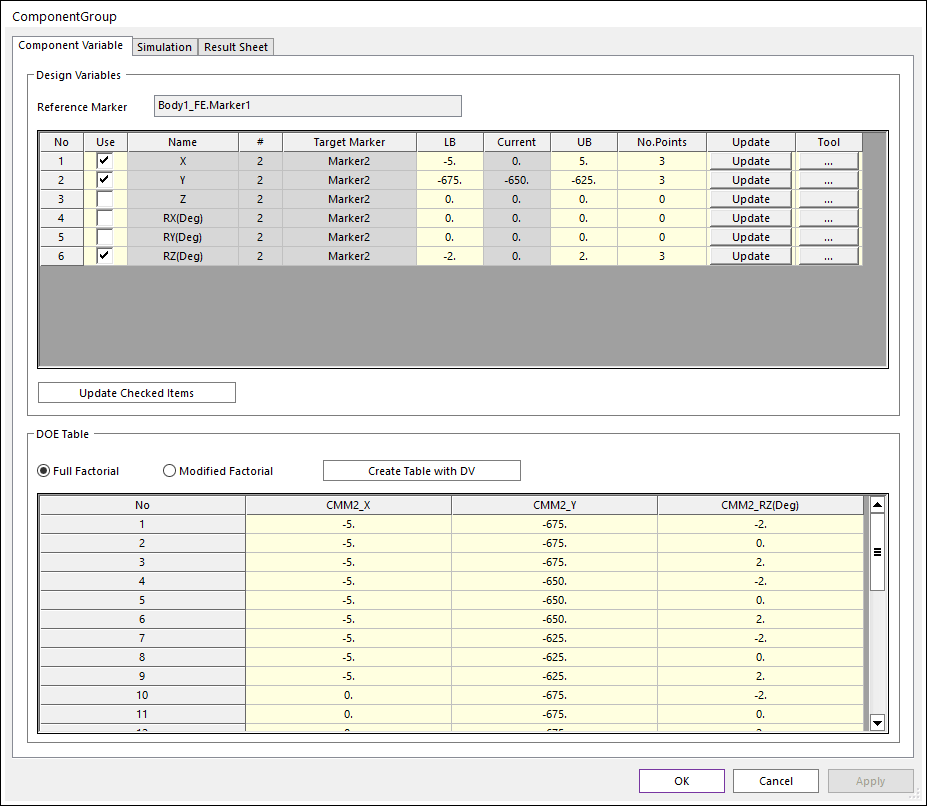
Figure 13.6 Component Variable page in ComponentGroup sheet
Use: If this option is checked, this means using that degree of freedom and creating it in the DOE Table.
LB: Lower Bound of selected DOF.
UB: Upper Bound of selected DOF.
No.Points: The number of points.
Update: Update the changed contents to the division points.
Tool: Tools to help create points. If you set LB, UB, and the number of points, points are created according to the values.
Update Checked Items: Updates Design variables information to the DOE Table.
Full Factorial: Create a DOE table that maps information on all design variables.
Modified Full Factorial: Create a DOE table using the Modified Full Factorial method.
Create Table with DV: Create DOE table based on DOE cases with factorial design.
Note
Rx, Ry, Rz in the Design Variables means rotation angle in the direction of x,y and z axis in euler angle ZYX. Refer to EULERANGLE.
13.1.3.2.2. Simulation Page
In this page, user can perform DOE analysis about component using static analysis. Here, it called Component Analysis
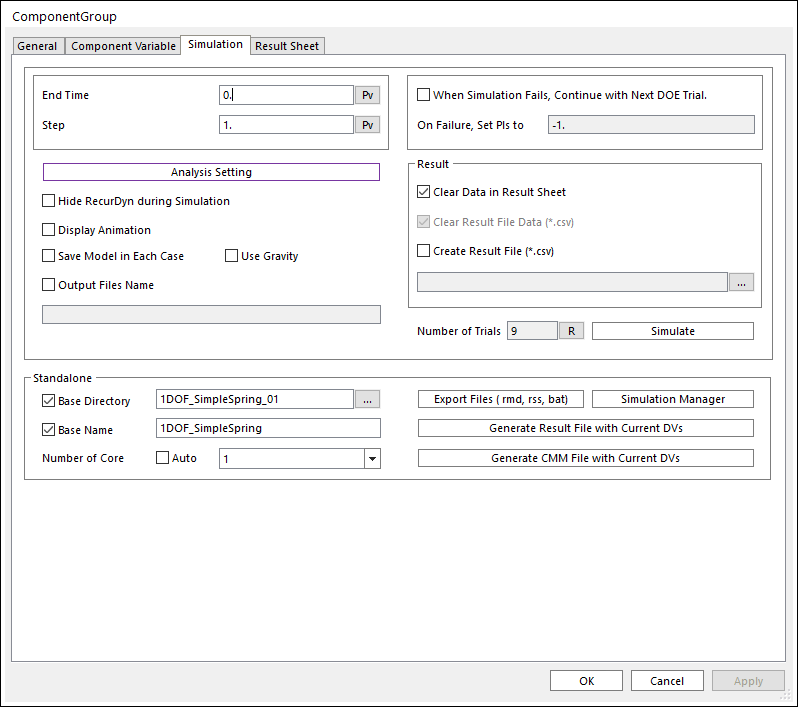
Figure 13.7 Simulation page in ComponentGroup sheet
End Time: Defines the end time of a simulation. If this option is not checked, Report Time Interval option is enabled and End time, Step and Plot Mutiplier Step Factor options are disabled.
Step: Defines the number of sampling data sets that are output for animation.
Analysis Setting: Defines the Static Analysis Parameter.
Hide RecurDyn during Simulation: If this option is checked, the RecurDyn program window is hided during simulation. So, the user can execute the fast analysis. By clicking the right mouse button on the RecurDyn icon at the tray, the user can stop a simulation or activate the RecurDyn main window.
Display Animation: If this option is checked, an animation is displayed during the simulation process.
Save Model in Each Case: Save he each model with used Parametric Value for simulation.
Use Graivty: Set the model using gravity or not.
Output Files Name: Set the output files name.
When Simulation Fails, Continue with Next DOE Trial: The simulation does not stop, when simulate fails. And the simulation is continued to the next DOE trial.
On Failure, Set PIs to: Set on the Result Sheet as a performance index’s value when the simulation fails. Only numbers can be inputted.
Clear Data in Result Sheet: Clear result data in result sheet before reporting.
Clear Result File Data: When creating a result table, delete the existing result table.
Create Result File: Create a file containing result table with the set name.
Number of Trials: This is the number of simulations executed based on DV Table and can be updated through the Refresh button.
Simulate: This button proceeds with the analysis as much as the determined Number of Trial.
Note
Static analysis is performed by changing the solver type of RecurDyn to exe solver. Therefore, it cannot be performed by executing two or more RecurDyn.
Standalone: You can perform DOE analysis by using Stand-alone solver.
Base Directory: Root directory of DOE model files.
Base Name: Prefix name of the file related to the created model.
Number of Core: The number of Solver Cores defined in the RMD file can be defined. This value is separate from the value in the Simulation Settings and is applied only when exporting RMD from DOE. Since this value has a great influence on the analysis performance, it is necessary to set it according to the environment.
Export Files (RMD, RSS, BAT): Export RMD and RSS files including PI information. In addition, a batch file that can simulate all models by batch command is created.
Simulation Manager: Utility execution that supports multi-simulation execution. (If base directory is set, automatically add cases). Refer to Simulation Manager.
Generate Result File with Current DVs: Create the result file with rpi information under the base directory. (The RPI file supports only expression type)
Generate CMM File with Current DVs: Create the CMM file with rpi information under the base directory. (The RPI file supports only expression type)
13.1.3.2.3. Result Sheet Page
After finishing component analysis, you can check result table which consist of DOE table and response data of them, and the functions to analyze the result with a chart is also supported.
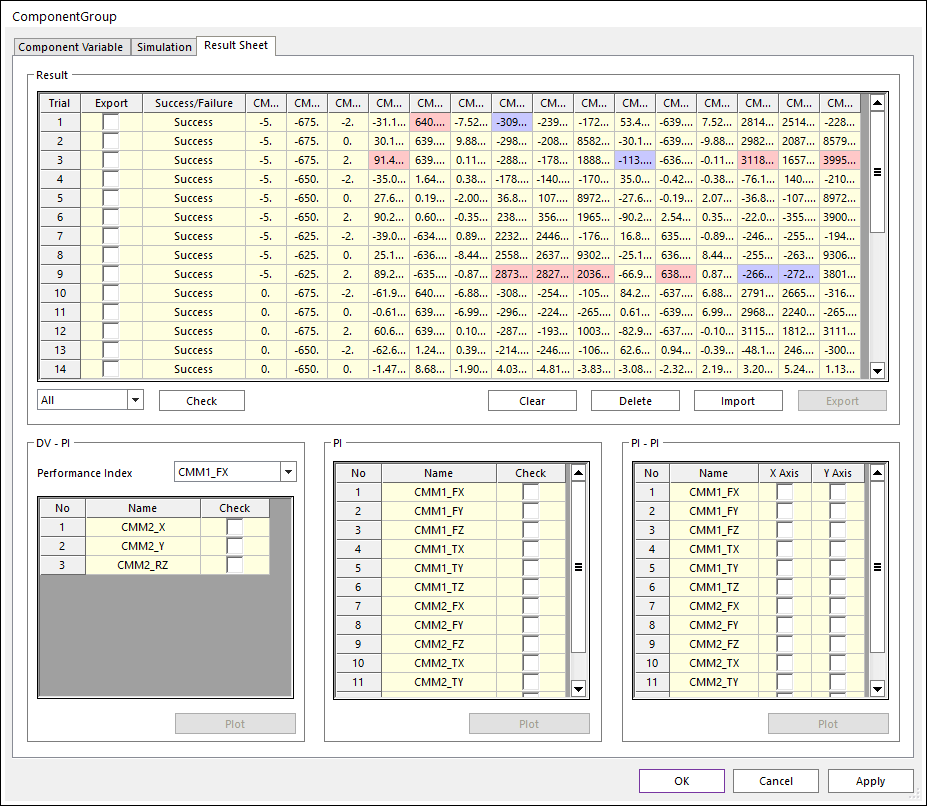
Figure 13.8 Result Sheet page in ComponentGroup sheet
Check: If you select the combo box (All/Failure/Success) and click the check button, only the relevant item is checked.
Clear: Clear the analysis results.
Delet: Delete the checked results.
Import: Import the result table file.
Export: Export the result table file.
DV-PI Plot: Chart of PI(Component Reaction Force) values corresponding to DV(Deformation of each Interface Marker’s DOF) values.
PI Plot: Chart of PI(Component Reaction Force) values.
PI-PI Plot: Chart showing two selected PI(Component Reaction Force) values on the defined axis.
Note