7.1.6.2. Update Plot
The user can draw plot curves with a name already exist in a chart for other rplt files. It is useful if the user wants to see a new plot curve compared with a previous plot curve.
Step to use
Analyzes a model. (The user has to check on Create Output Folder option in the Simulation dialog in the Model Setting group of the Home tab.)
Draws plot curves on the Plot Windows.
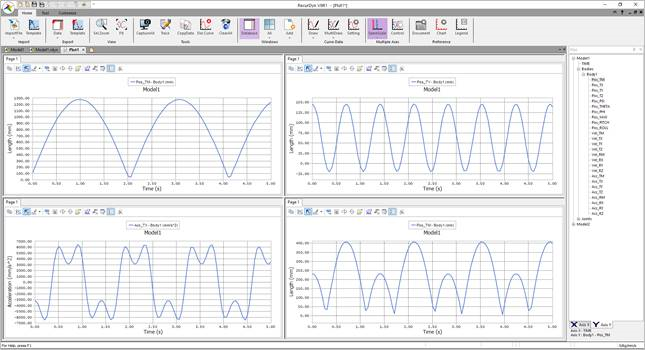
Figure 7.22 Draw plot curves
Analyzes the model by changing the parameters.
Returns to Plot Window and then imports the last rplt file.
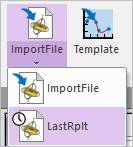
Figure 7.23 Import Last Simulated Rplt File icon of the Import group in the Home tab
Clicks the Update Plot icon.
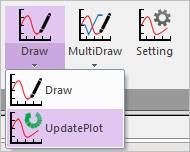
Figure 7.24 Update Plot icon of the Draw group in the Home tab
Checks the data to be updated.
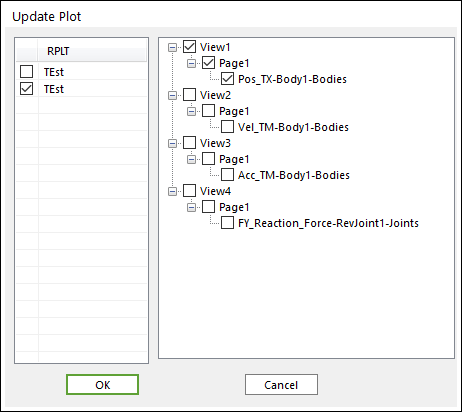
Figure 7.25 Update Plot dialog box
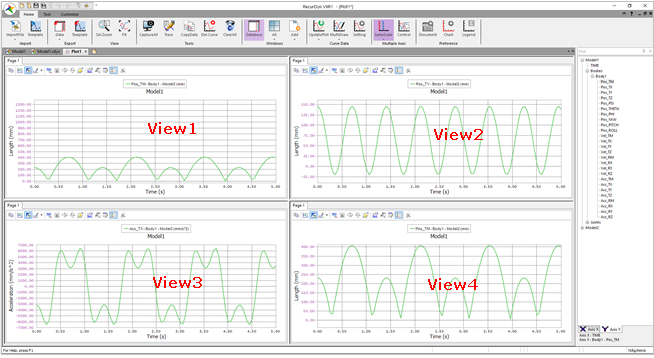
Figure 7.26 After performing the Update Plot function
Note
This function is activated when the rplt file should be more than 2 and a plot curve should be drawn at least one.