20.6.2.1. Scope
The user can graph output data using Scope in output library. A Scope block draws x-y plot that x data are simulation time and y data are input data of scope.
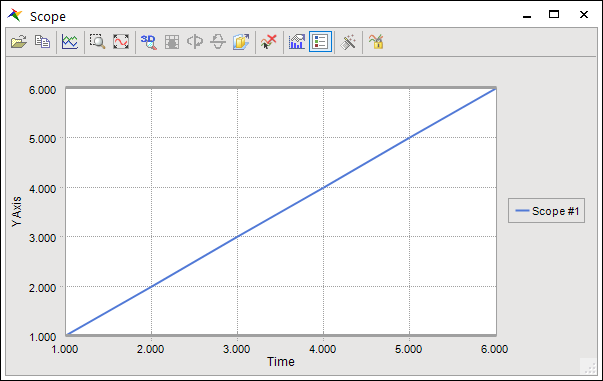
Figure 20.50 Scope window
Import/Export: Allows to import and export measured data using this command.
Copy to Clipboard: Exports in different formats, including Bitmap, Metafile and Text (data only).
Gallery Style: Apply various chart types, widely used Line, Curve, Scatter, Area, Area-Curve, Bar and Step.
Zoom: Allows using zoom effects.
Fit
3D/2D: Allows be viewing in 2D or 3D, and rotating to specific angles and perspectives.
Rotated View
Rotate Around Y Axis
Rotate Around X Axis
Clustered(Z-Axis)
Delete selected Curve
Axes Settings: To set up more option, please double click each axis.
Y Axis: Setting up Grid and Interlaced.
X Axis: Setting up Grid, Vertical Labels, Staggered and Show Labels.
Legend Box: Shows the Legend Box on the Chart.
Properties: Generalizes of the Chart Toolbar. Refer to Chart Properties
Hold previous data: Allows holding the previous plotting data.