5.16.4. Contour
This tool enables the contour display for contact pressure, sliding velocity and PV(Pressure Velocity) that occurs to the rigid body.
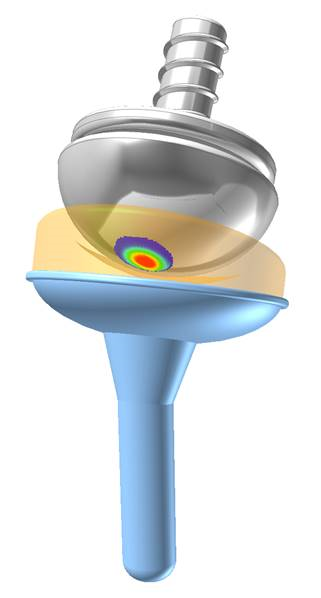
Figure 5.134 Contour Display
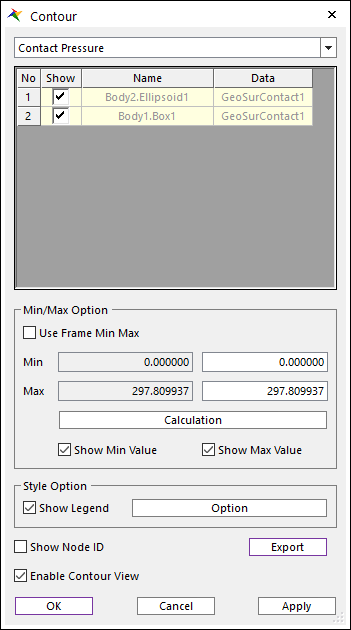
Figure 5.135 Contour dialog box
Contour Type: Selects the type of contour to display. There are 3 types.(contact pressure, sliding velocity and PV(pressure velocity))
Contact Pressure, Sliding Velocity and PV (Pressure Velocity).
Contour List: The list of contour the user can display.
Show: The user can draw contour for the checked list. And Min/Max is also calculated for the checked list.
Name: The name of the patch to draw the contour. If the user clicks it, the patch is highlighted on Working Window.
Data: The name of the entity which generated the contour data.
Use Frame Min Max: If this option is on, contour display uses the minimum and maximum values for each frame, not total.
Min/Max: The calculated total minimum or maximum values can be displayed at first edit box, and the user can choose the appropriate value at second edit box.
Calculation: Calculates the total minimum and maximum values.
Show Min Value/Show Max Value: If this option is on, the position which has the minimum or maximum values is displayed on Working Window.
Show Legend: If this option is on, the legend of this contour is displayed on Working Window.
Option: Opens the Legend Option dialog, and the user can modify the legend options with it.
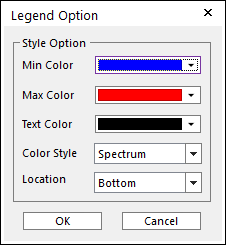
Figure 5.136 Legend Option Dialog box
Min Color: Sets the color for min value.
Max Color: Sets the color for max value.
Text Color: Sets the color for text.
Color Style: Selects a type to full colors in the contours. The default is Spectrum. In the Gray Scale type, only gray colors are used.
Location: Indicates the position of legend. The default is Bottom.
Show Node ID: If this option is on, the object’s node id is displayed with patch when the name column of it is clicked.
Export: Export the data in contour file of objects checked ‘Show’ button with csv file format.
Enable Contour View: If this option is on, the contour is displayed.