21.3.8.2. Basic Concept of Effect Analysis
In the classical DOE (Design of Experiment), the effect analysis and ANOVA are important analysis techniques. The effect analysis is used to find the design improvement and the ANOVA is done to validate the effect analysis results. When the effect analysis was used in the classical DOE, the design variables were discrete and the observation (performance indexes) had measuring errors. The computer simulation, however, has no measuring error and continuous design variables. Thus, the effect analysis has been less effective than other optimization techniques, because it cannot estimate the nonlinear behavior of performance index.
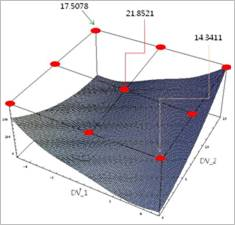
Figure 21.102 typical nonlinear behavior of performance index
Figure 21.102 shows a typical nonlinear behavior of performance index from computer simulation. The red points denote 3-level full factorial design points. Two design variables have three levels such as L, M, and U, respectively. Let’s consider the effect analysis for DV1 and DV2. First, evaluate the mean of performance values when DV1 is L, M, and U, respectively. Similarly, same evaluation can be done for DV2.
Figure 21.103 shows the mean values for DV1 and DV2. This comparison is called as Effect Analysis. When one finds to minimize the performance, he or she selects the design levels that represent the minimum height in the effect analysis results. In Figure 21.103, DV1=M and DV2=M is the minimum combination. Also, DV1=L and DV2=L is the maximum combination. Compare the minimum combination with the behavior shown in Figure 21.102. The minimum combination of Figure 21.102 shows DV1=U and DV2=L.
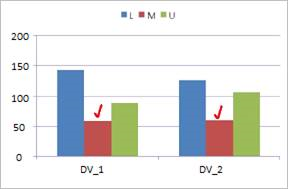
Figure 21.103 typical effect analysis result
Why the effect analysis gives different result?
As the original DOE methods considered the measuring errors, they used the mean values for effect analysis and the variance for ANOVA. The computer simulation, however, gives the unique values for the same input data. Thus, the original effect analysis concept is not appropriate. Especially, when the design range (the interval among L, M and U) is large, its estimation is less accurate.
AutoDesign gives the variation chart to help one’s choice of design improvement. The variation chart draws the variance for design levels. Figure 21.104 shows the effect analysis and variation charts. When DV1=5th Level, the performance is a minimum and it’s is small. The effect value of DV2 is nearly ‘0.9’ but its variance is nearly ‘0.4’ Thus, it has no significant which levels of DV2 is best.
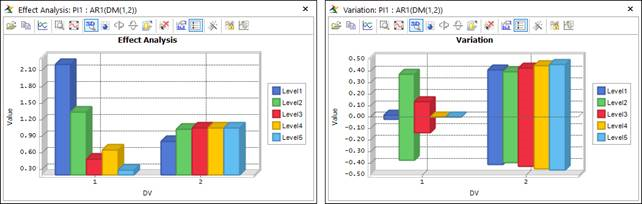
Figure 21.104 Effect analysis and variation results