17.2.3. Vibration Animation Condition
The Vibration Animation Condition dialog shows the average FFT result in order to select the target frequency.
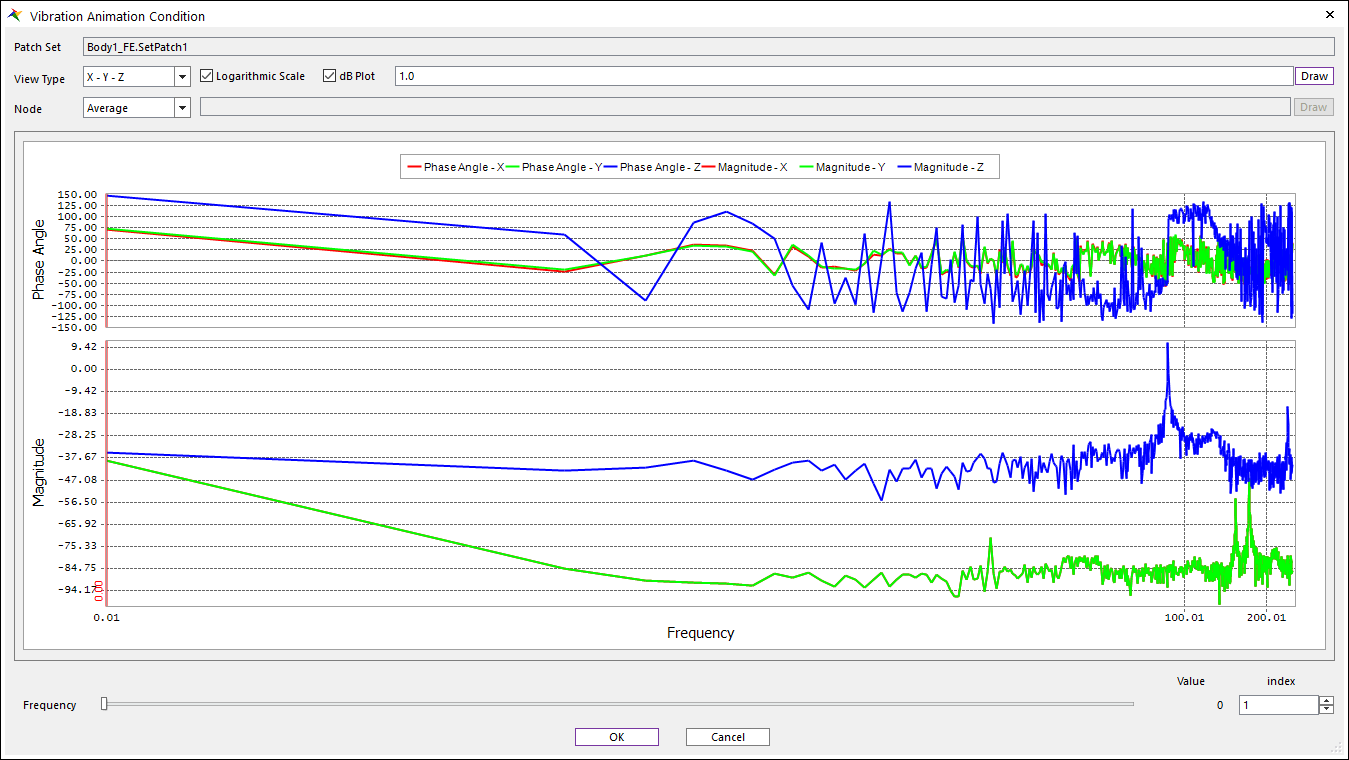
Figure 17.7 Vibration Animation Condition dialog box
Patch Set : Shows the selected Patch Set
View Type : Selects the view type. The default is “X-Y-Z”.
Logarithmic Scale : Changes the x-axis to a log scale.
dB Plot : Changes the magnitude to a decibel. \(20.0*log10(m_{magnitude} / r_{ref})\).
a decibel reference value (= \(r_{ref}\) ) : Default value is 1.0.
Draw button : draws the plots using the decibel reference value.
Node : The user can see the average or each nodal FFT data.
Average : Shows the average data of all nodes on the patch set
Single : Shows a Nodal FFT data
Draw button : Selects a node including the Patch Set.
Frequency : Selects the target frequency for the Vibration Shape animation.
Slider Bar and Index is available for the selecting.