44.6.2. Parameter Concept (Plot Automation)
44.6.2.1. Definition of RPLT
The RPLT is result data for Plot and Scope. The user has to choose a way between two methods to define RPLT. One is to use the recent simulation result. The other is to use the imported RPLT file. The user can define both of methods at the same time.
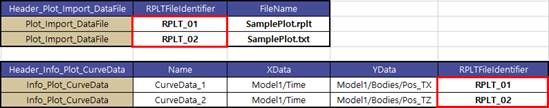
Using the imported RPLT file
Prepare a RPLT file(*.rplt, *.txt) to be used Plot Automation.
In the data sheet, define the RPLT file and the RPLTFileIdentifier in order to classify several RPLT.
When define the curve data, write the RPLTFileIdentifier name you want to use. The commands to draw curve as below example.
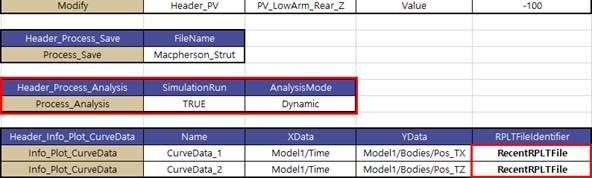
Using the recent simulation result
Prepare a template file included simulation command.
When define the curve data, write the RecentRPLTFile in RPLTFileIdentifier. The commands to draw curve as below example.
44.6.2.2. Definition of Curve and Form
When the user uses Plot Automation, in order to apply various chart effects, the user should control the chart properties. So, eTemplate Plot Automation supports to set various chart effects.
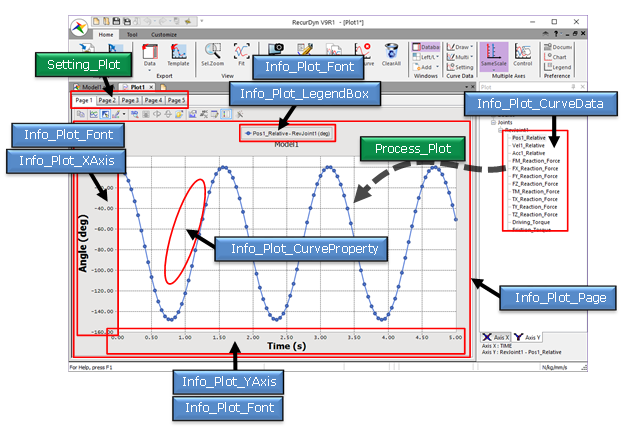
Parameters for drawing plot curve
Info_Plot_CurveData: Information parameter to define the plot curve data.
Info_Plot_CurveProperty: Information parameter to define the curve properties(Line style, Color, …).
Info_Plot_XAxis: Information parameter to define the X-Axis properties(Min, Max, Grid, Color, …).
Info_Plot_YAxis: Information parameter to define the Y-Axis properties(Min, Max, Grid, AxisPosition, Color, …).
Info_Plot_LegendBox: Information parameter to define the legend box properties(DockedPosition, Font, …).
Info_Plot_Page: Information parameter to define the page properties(BackGroundColor).
Info_Plot_Font: Information parameter to define the font properties(Type,Size, …).
Setting_Plot: Defines the number of pages and plot axis type. The default value of plot axis type is SameScale.
SameScale: Y-Axis is the same automatically.
NewAxis: All Y-Axis is created independently.
Process_Plot: Defines the curve to be drawn in the plot and defines whether drawing process runs or not.