39.1.2.6. Output Data Export
The user can display (plot) or export the film thickness and film pressure with various options. This function is activated after dynamic simulation ends.
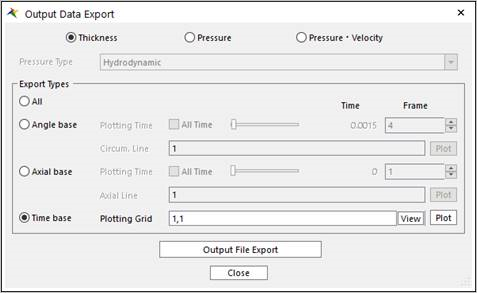
Figure 39.23 Output Data Export dialog box
Oil Film Thickness, Oil Film Pressure and Pressure · Velocity: Choose Thickness, Pressure or Pressure · Velocity (Hydrodynamic, Asperity Contact, Hydrodynamic + Asperity) as a post-processing data.
Export Types
All: Exports all data for the selected data type (thickness or pressure).
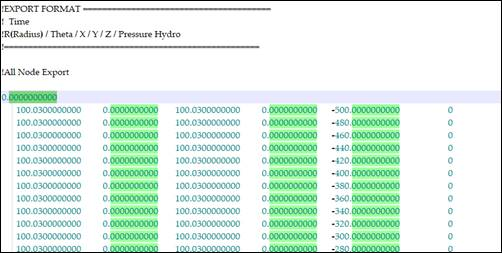
Figure 39.24 Output text file for All export type
Angle base: Plots or exports the selected data after defining the plotting time and the circumference line as the following figure.
All Time: Result data is exported for the all of time step. If this option is checked, plot curve cannot be displayed.
Circum. Line: Specify circumferential line in order to check result.
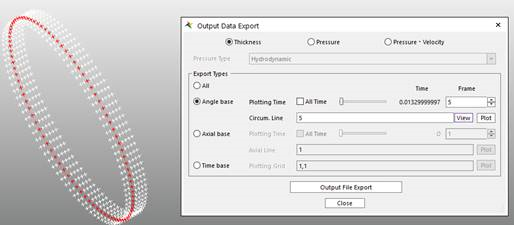
Figure 39.25 Selected grids in Angle Base
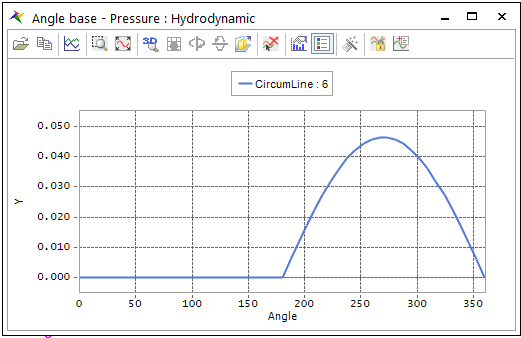
Figure 39.26 Plot for Angle Base export type
Output Data File Format: Result data for selected grids are written by each column.
1st row: Radius2nd row: Theta3rd ~ 5th row: X, Y, Z6th row : pressure or thickness at specific time for the current grid. (if All time option is checked, the results of every time steps are written in row order.)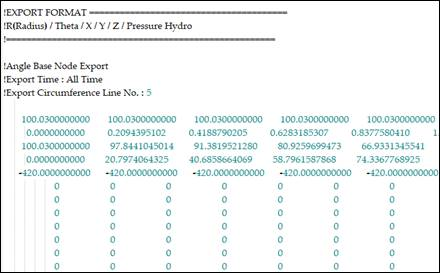
Figure 39.27 Output text file for Angle Base export type
Axial base: Plots or exports the selected data after defining the plotting time and axial line as the following figure.
All Time: Result data is exported for the all of time step. If this option is checked, plot curve cannot be displayed.
Axial Line: Specify axial line in order to check result.
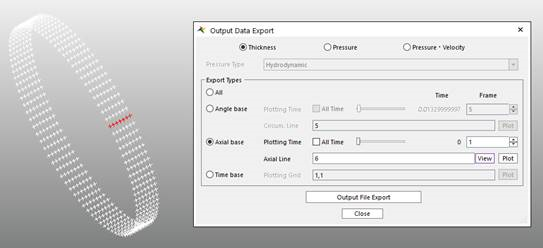
Figure 39.28 Selected grids in Axial Base
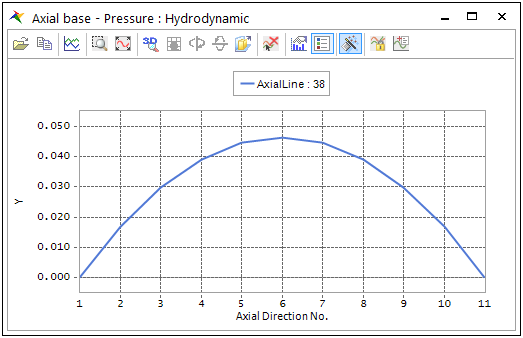
Figure 39.29 Plot for Axial Base export type
Output Data File Format: Result data for selected grids are written by each column.
1st row: Radius2nd row: Theta3rd ~ 5th row: X, Y, Z6th row : pressure or thickness at specific time for the current grid. (if All time option is checked, the results of every time steps are written in row order.)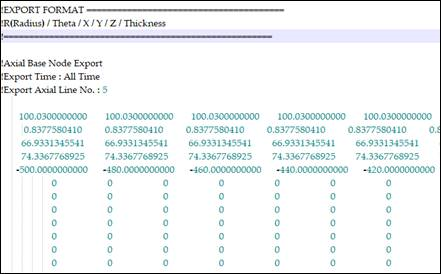
Figure 39.30 Output text file for Axial Base export type
Time base: Plots or exports the selected data after defining a grid by (start index in circumferential, start index in axial - end index in circumferential, end index in axial). For example, If plotting grid is defined like (1,1 – 5,4), grids which has index below is defined.
[(1,1), (1,2), (1,3), (1,4), (2,1), (2,2), (2,3), (2,4), (3,1), (3,2), (3,3), (3,4)(4,1), (4,2), (4,3), (4,4), (5,1), (5,2), (5,3), (5,4)]Additional grid groups can be created by the separator ‘;’.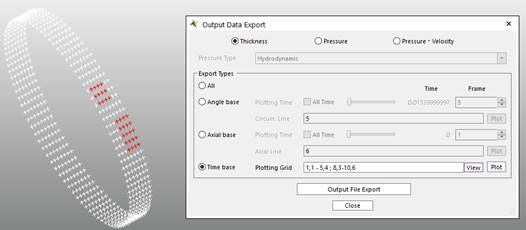
Figure 39.31 Multiple selection for Time Base export type
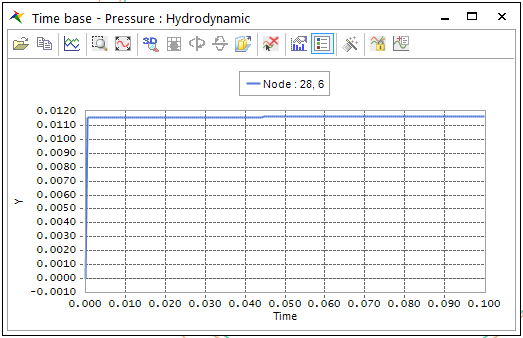
Figure 39.32 Plot for Time Base export type
Output Data File Format: Based on selected mesh grids, result data(Radius, Theta, X, Y, Z, Pressure or thickness) for the grid is written in each column by time step.
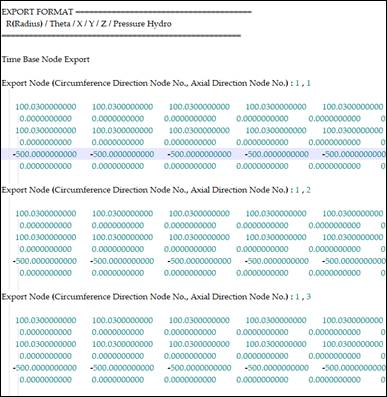
Figure 39.33 Output text file for Time Base export type
The reference marker of EHD is equal to the base marker of EHD.
If the user uses Output File Export, the user can obtain a file which has extension out. The file has the consistent data with selected conditions.
The Mesh to the EHD analysis is generated based on the reference marker of EHD. Therefore, each position of nodes listed in the out file is expressed with respect to the reference marker of EHD.
Note
The force result (FM,FX,FY,FZ,TM,TX,TY,TZ ) in RecurDyn plot file is only evaluated for the action body. They are evaluated w.r.t the Base Marker of EHD. Hydro indicates the force resulting from hydrodynamic pressure and asperity indicates the force resulting from asperity contact. VolumeFlowRate_FrontEnd means the volume outflow rate in axial direction at the end of the positive z direction of base marker and VolumeFlowRate_RearEnd means the volume outflow rate in axial direction at the end of the negative z direction of base marker.