9.10. Post Process in FFlex
Simulation results for the FFlex body are communicated by:
The way of displaying color contours on the surface of flexible body.
The way of displaying vector plot for principal strain or stress on the surface of flexible body.
Graphing data in the Plot and Scope windows.
The Contour option:
Displays displacements, strains, and stresses.
Includes a color legend that indicates the numeric range of colors.
Enables you to animate many kinds of outputs.
The Plot and Scope options:
Give nodal results in the form of curves on a graph, based upon a set of output nodes defined in the Body Edit Mode of FFlex body.
Are valuable for interpreting various dynamic results.
Caution
RFA, RFT, ERD and SRD files should be generated for each FFlex body in the model after a successful dynamic analysis.
All the post-processing about the Flexible body is based upon these files.
For the animation of the FFlex body, these files should remain in the same working folder as the other RecurDyn model and output files.
The name of animation files is composed with the names of each FFlex body combined with the following file extensions.
*.rfa: displacement animation data.
*.rft: temperature animation data.
*.erd: strain recovery data.
*.srd: stress recovery data.
The ERD and SRD files are set at Output File Regenerator. For more information, click Output Regenerator.
Step to view Contour Animation
You can follow the example steps below to display a contour animation of FFlex body. Please refer to the section in the dialog box of Contour for a detailed explanation of all options.
Perform the dynamic analysis of a model that includes a FFlex body.
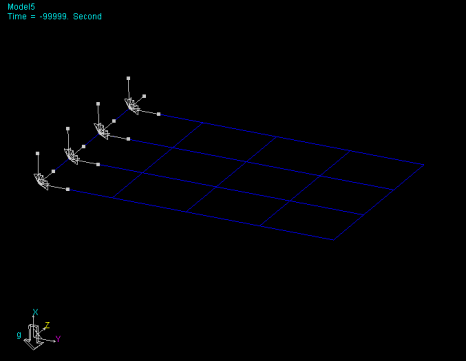
Figure 9.147 FFlex body
Click the Contour icon of the FFlex in the Flexible tab. The dialog box shown in Figure 9.148 appears.
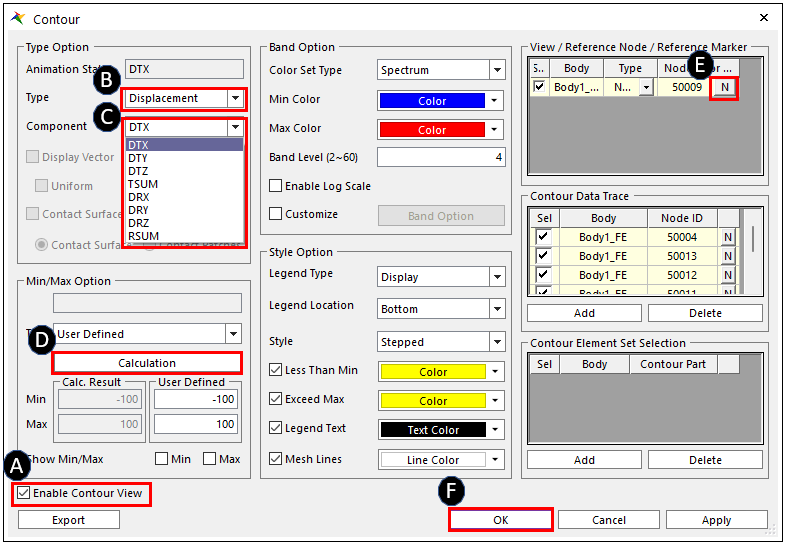
Figure 9.148 FFlex Contour dialog box
A: Checks Enable Contour View to activate the dialog box of Contour.
B: Selects one of three Contour Types from the pull-down menu, such as Displacement, Strain and Stress.
C: Selects one of the specific contour names from the list that corresponds with the Contour Type. Note that the Animation State field is filled in with the same contour name.
D: Clicks Calculation to find the Min/Max value of selected Contour type.
E: Navigates a node on the FFlex body for Reference Node in case of Displacement Contour Type.
F: Clicks OK.
You can:
Change the Min/Max Option Type to User-defined if you would like to set the minimum and maximum values of displayed contours manually.
Modify the appearance of the contour by changing the Band Option and Style Option. It is possible to export contour data. It is possible to export contour data.
Play the animation of this model.
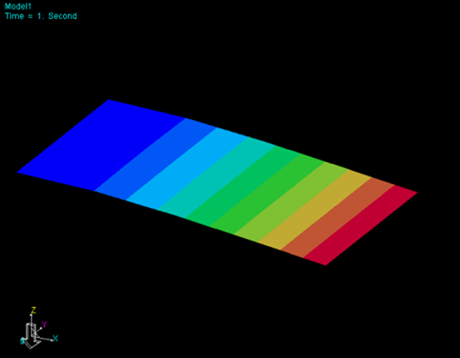
Figure 9.149 Contour animation