21.2.3.7. Reliability Analysis by using Monte-Carlo Simulation
In order to evaluate the probability of failure, Monte-Carlo simulation provides 2 sampling method such as Latin-hypercube sample and random sample. Latin-hypercube sample is recommended.
21.2.3.7.1. Run Steps of Monte-Carlo Simulation
Select the Monte-Carlo icon of the Reliability group in the AutoDesign tab.
Figure 21.61 Monte-Carlo icon of the Reliability group in the AutoDesign tab
Define the information of random constant
Check Design Variable in the Reliability: Monte-Carlo dialog and select the probability distribution and deviation value type. The current values of the selected variables are regarded as mean values. As the selected design parameters (DP) are random constants, their types are represented as Constant.
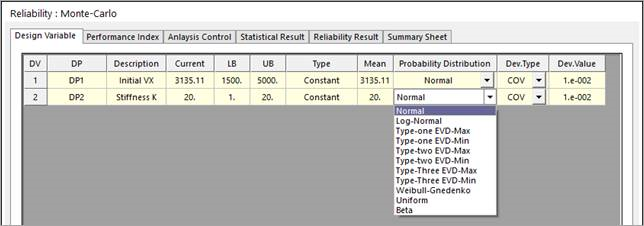
Figure 21.62 Define the information of random constants
Probability Distribution: For reliability analysis, one should define the probability distribution type for each random constant. AutoDesign provides 11 types of probability distributions. The detailed information of the probability distributions is explained in Probability Distributions.
Deviation type: The standard deviation types. SD is ‘standard deviation value’. COV is ‘coefficient of variance’, which is SD/Mean value.
Define the limit state function
Check Performance Index in the Reliability: Monte-Carlo dialog and select the analysis responses to define the limit state relation. Figure 21.63 shows that two ARs are less than their limits. This represents that the system is failed when one of ARs is greater than its’ limit.
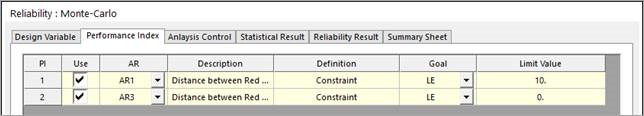
Figure 21.63 Define the limit state function
Define the Analysis Control
Check Analysis Control in the Reliability: Monte-Carlo dialog. Then, you can see the simple menu window. Define the number of sampling points. The Reliability Analysis explains the guideline of the numbers. Two sampling method are provided such as Latin-Hypercube and Random sampling. Latin-Hypercube’ is recommended. It is noted that Get From Simulation History can be included to the new sample points.
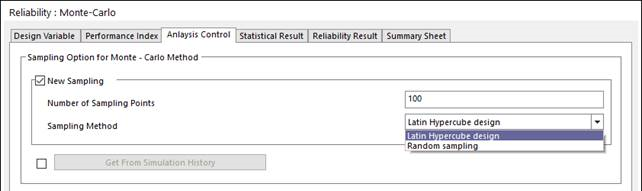
Figure 21.64 Define the Analysis Control
21.2.3.7.2. Result Sheet of Monte-Carlo Simulation
Check Result Sheet in the Reliability: Monte-Carlo dialogue. Then, you can see the sample points and the distribution of performance index. First, select DP1 and DP2 as horizontal and vertical axis, respectively. And push Draw button. Then, the sampling points are shown. Next, select PI1 in the performance index and push Draw button. Then, you can see the distribution of analysis results for the sample points. Figure 21.65 shows the distribution of PI1.
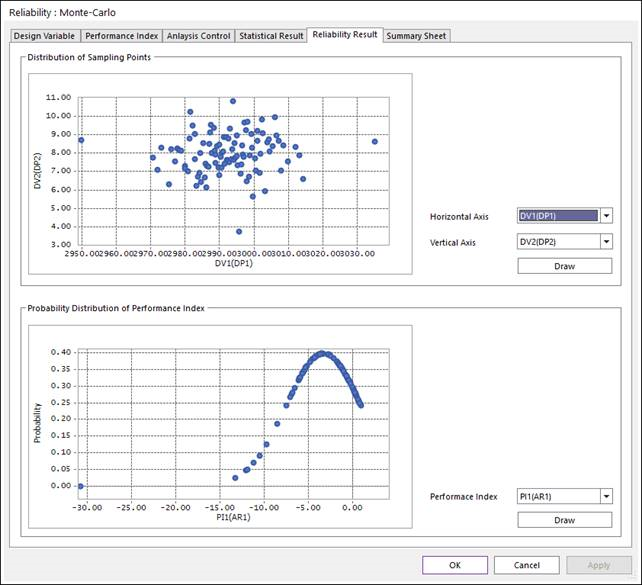
Figure 21.65 Monte-Carlo Result
21.2.3.7.3. Summary Sheet of Monte-Carlo Simulation
Check Summary Sheet in the Reliability: Monte-Carlo dialogue. Then, you can see the reliability analysis result. Statistical Variables lists the random constant information. Param_1 ~ Param_3 are the statistical values for defining the probabilistic distributions, which are internally evaluated from the given information such as mean, standard deviation and distribution type. Performance Index (Formulation) lists the limit state function formulation and the failure of probability. Among the analysis results of 100 sample points, 80% of AR1 is greater than limit. Next, Performance Index (Result) shows the validation information of Monte-Carlo simulation. For more detailed information, one may refer to Basic Concept of Effect Analysis or Reliability Analysis.
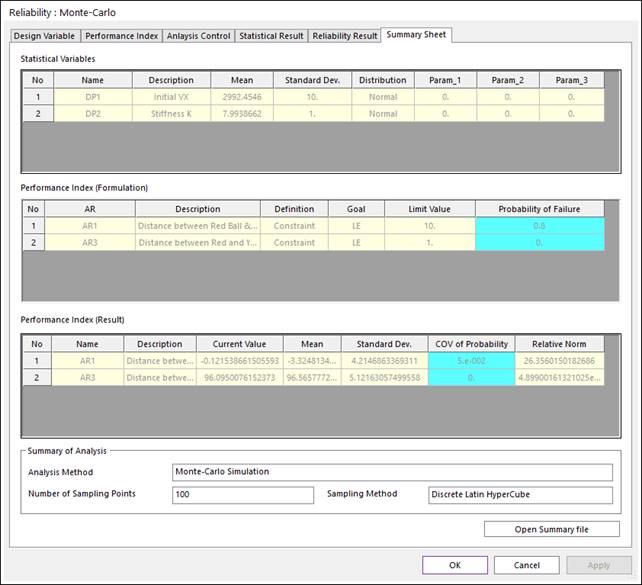
Figure 21.66 Summary result