21.2.3.3. Design Study
Users can progress the design study process for the effect analysis. 6 DOE methods are supported for the DOE process, user can analysis the effect of design variables about performance indexes. For the detailed theory of the DOE methods used in Design Study, refer to Basic Theory.
21.2.3.3.1. Run Step of Design Study
Select the Design Study icon in the Optimization group of the AutoDesign tab.
Figure 21.30 DesignStudy icon of the Optimization group in the AutoDesign tab
Define the DOE method in the Design Variable page.
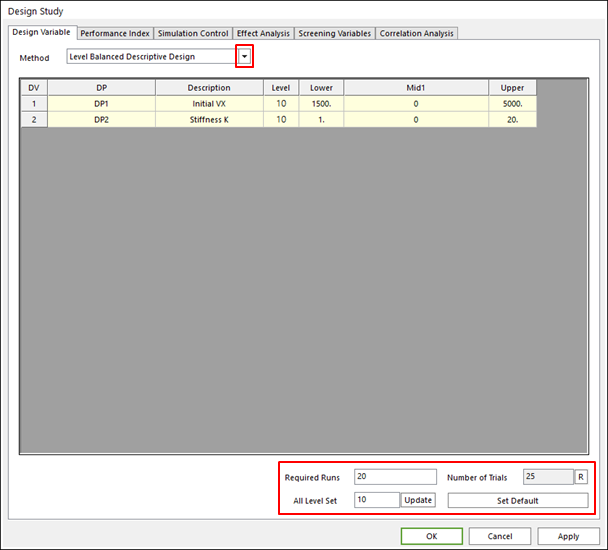
Figure 21.31 Design Variable tab of the Design Study dialog box
Method: Select the DOE method for Design Study. Some DOE types need the setting options tools like as Required Runs, All Level Set.
DV list: Check the selected design variables.
Required Runs: Is the maximum number of runs defined by users.
Number of Trials: Is the defined number of runs from the level setting and the required runs.
If the number of runs calculated from the level setting is 50 and the required runs is 20, then the Number of runs is defined 20.
The ‘R’ button refreshes the defined ‘required runs’.
All Level Set: Define the level of all design variables. The Update button changes the numbers of the ‘Mid1’ section. You can modify value in the ‘Mid1’ section. But if you want to use default values, click the Set Default button.
Check Performance Index (in Figure 21.32)
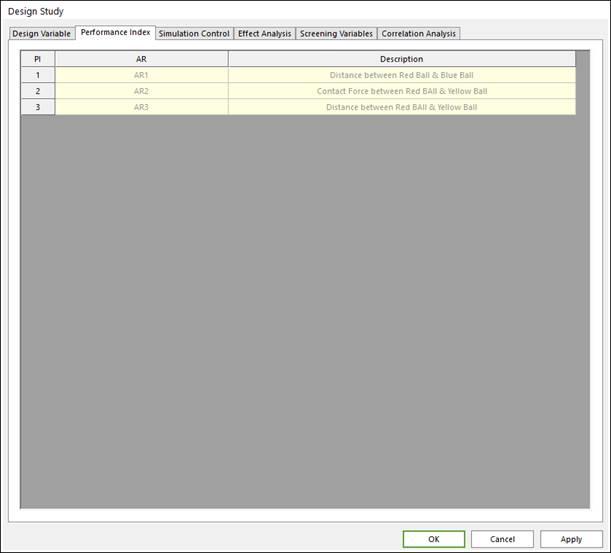
Figure 21.32 Performance Index tab of the Design Study dialog box
Run the simulation (in Figure 21.33).
Confirm the simulation type and analysis parameter in the Simulation Control page of the Design Study dialog. And run simulation by click the Execution button.
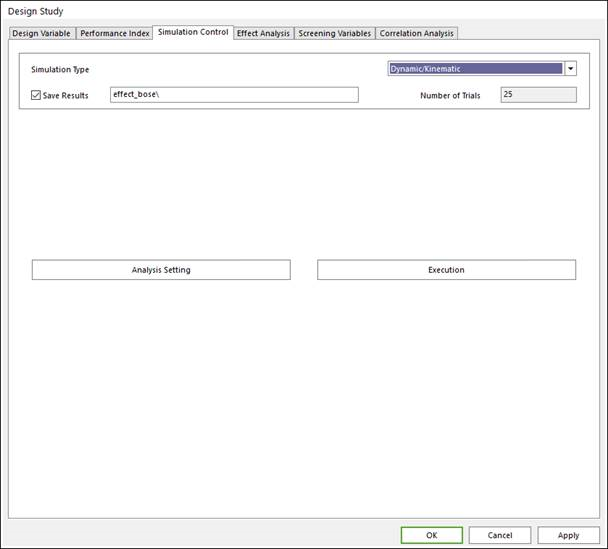
Figure 21.33 Simulation Control tab of the Design Study dialog box
Simulation Type: Select the simulation type for analysis. The options are Dynamic/Kinematic, Static, Eigen, Pre. For redefining analysis setting like as end time, step, etc, click the Analysis Setting button, then the Analysis dialogue is opened.
Save Result: If one wants to save the result as special model name in the special directory in computer, then check the check box and write the blank like as the Figure3-20, effectDesignStudy. effect is the name of the specialized directory, and DesignStudy is the specialized model name.
Simulation Button: If you ready for the process, click this button. Then the summary of Formulation dialogue is opened like as in Figure 21.34 and you can check the formulation for process. If this information is right for your purpose, then click Simulation Button.
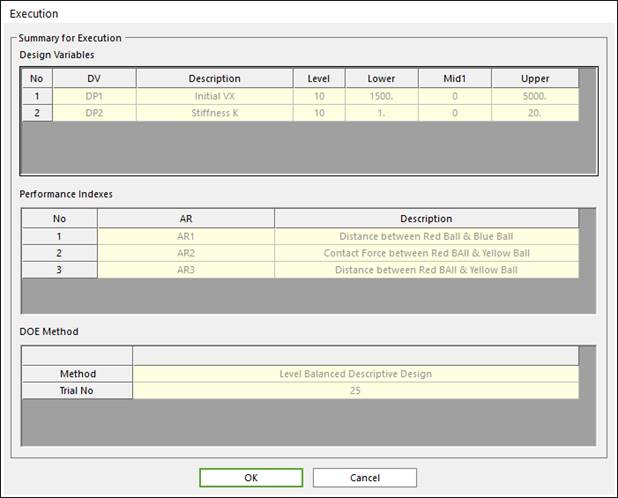
Figure 21.34 Execution dialog box
21.2.3.3.2. Tools of analysis results of Design Study
Effect analysis
Users can analyze the effect of design variable about the selected performance index.
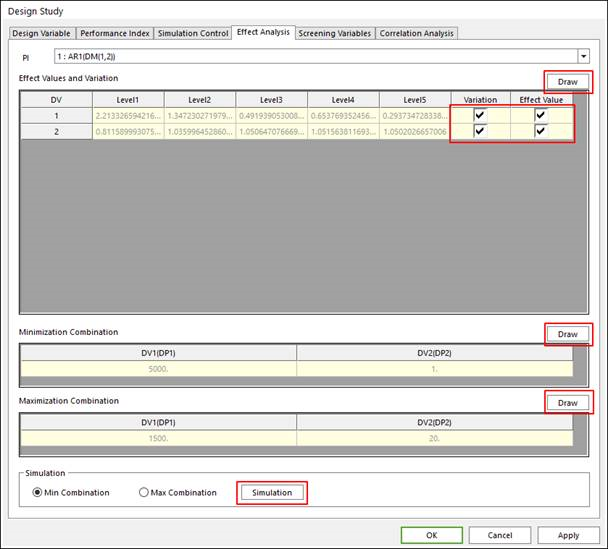
Figure 21.35 Effect Analysis tab of the Design Study dialog box
PI: Selects performance index for effect analysis
Effect Value: Selects design variable for effect analysis plot. Then click the Draw button for plotting like as the Figure 21.35
Maximization Combination & Minimization Combination: It shows the value of the design variable about the case of the maximization or minimization case of selected PI like as the Figure 21.36
Simulation: Simulate for the case of the maximization or minimization combination.
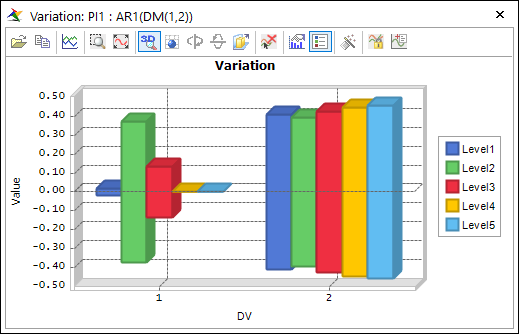
Figure 21.36 Effect Analysis plot

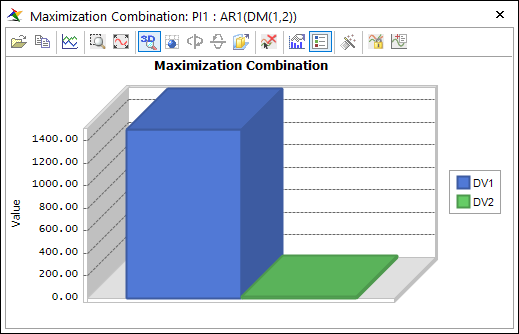
Figure 21.37 ‘Minimization Combination’ & ‘Maximization Combination’
Screening variable
Sometimes, some defined design variables cannot affect the defined performance indexes, and one wants to redefine model except the not effected design variables. For that case, this screening variable tool is supported.
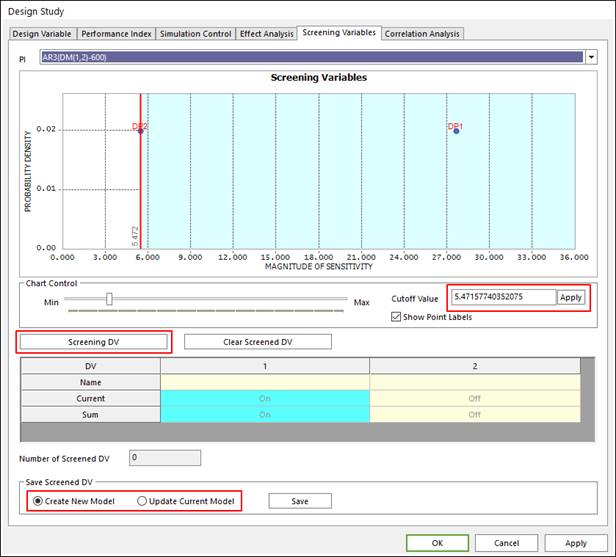
Figure 21.38 Screening Variables tab of the Design Study dialog box
PI: Select performance index for screening
Cutoff Value: Cutoff Value is represented a red line in the plot in Figure 21.38. Apply button can make to refresh the cutoff value line in plot.
Screening DV: If one is ready to screen design variable, click this button, then the left side design variable of the cutoff value line is turn off.
Number of Screened DV: This is represented the total number of screened design variables.
Update DV: Make model applied screened design variable as new model or current model. Select model type and click Save button.
Correlation Analysis
In Correlation Analysis page, user can plot the relationship between performance indices. Figure 21.39 shows the typical result. The one performance index must be selected for each axis, and the next users click Draw button.
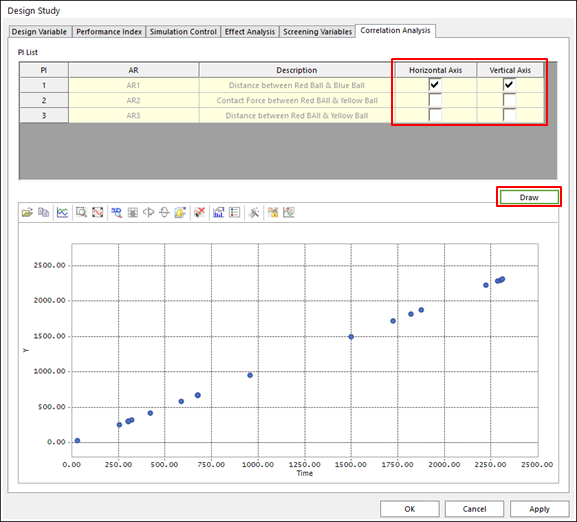
Figure 21.39 Correlation Analysis tab of the Design Study dialog box