8.4.3.2. Analysis
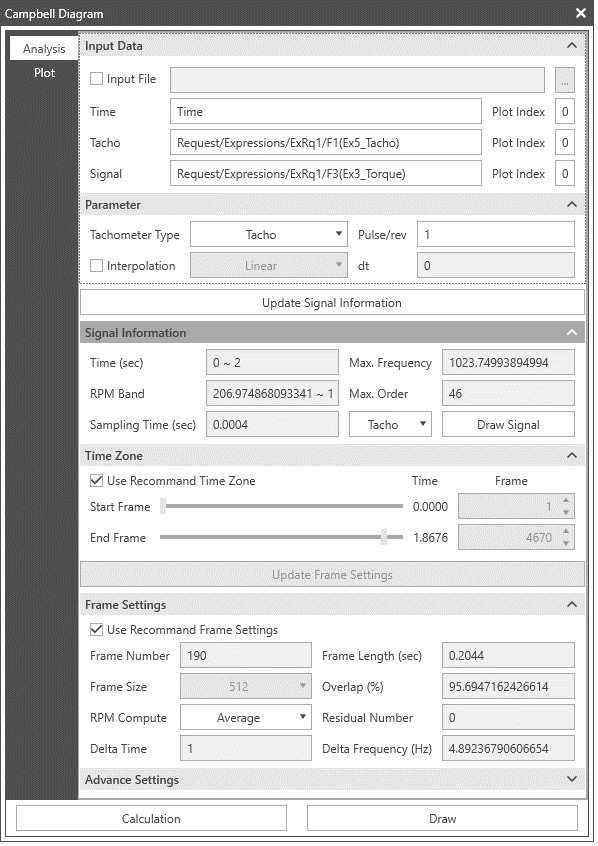
InputData |
Input File |
If this option is checked, it uses the imported data file (*.csv) to calculate the Campbell Diagram. Note: The 1st row of data file (*.csv) is time, 2nd row is tacho and 3rd row is signal. |
Time |
Is time of the data. The time data must match the Tacho data and signal data. Easy way to set this data is drag the entity from Datafile Database. |
|
Tacho |
The Tacho data represents the cyclic trigger signal for the completion of each rotation, in the form of one trigger to one cycle. When this data is inputted in the form of sine function, step function, or impulse function, RecurDyn’s Campbell process must convert it into RPMs before use. Easy way to set this data is drag the entity from Datafile Database. Note: If the Tachometer Type is RPM or rad/s, input data must be changed accordingly. For more information, refer to Step 0) Preparing the Data. Note: In the case of RPM and rad/s, the calculated RPM is defined as a positive number. Therefore, an absolute value function is used for calculating RPM. |
|
Signal |
Is the signal of the data. Easy way to set this data is drag the entity from Datafile Database. |
|
Plot Index |
Distinguish data of plot files with index. It is useful when more than one rplt files are loaded. |
|
Parameter |
Tachometer Type |
Change input type of Tacho with its value. It supports Tacho, RPM, rad/s. |
Pulse/rev |
After you enters the Tacho or RPM or rad/s, the final RPM is multiplied by the Pulse/rev or RPM Multiplier or Multiplier. The default value is ‘1.’ This function is used when the RPM of the entered signal is a multiple of the actual system RPM or when one cycle of the tacho signal is a multiple of the actual cycle. |
|
Interpolation |
When the report step size is not uniform, the Interpolation is necessary. There are two interpolation types, Linear type and Spline type. You check on the interpolation option, select the interpolation type and insert desired step size and the interpolated signal data will be used for Campbell diagram. |
|
dt |
It is interpolation step size. It is used when Interpolation is applied. |
|
Update Signal Infor mation |
Update signal information. It must be used before you proceeds. |
|
SignalInformation |
Time (sec) |
Show the time of processed signal. |
RPM Band |
Show the RPM band of processed signal. |
|
Sampling Time (sec) |
Show sampling time of processed signal. |
|
Max. Frequency |
Show the maximum frequency of processed signal. |
|
Max. Order |
Show the maximum order of processed signal. |
|
Draw Signal |
Used to draw the following signals in the Plot. It supports Tacho, RPM, dRPM, Signal, Signal FFT. |
|
TimeZone |
Use Recommend Time Zone |
Selects the time zone for which linearity is guaranteed for the RPM data increase rate automatically. If the system calculates the time differential values of the RPMs from the beginning to the end of the data and locates an increase or decrease above a certain value, then the time zone of variance is excluded. If no time zones of variance are found, then the system uses all the data. |
Start Frame |
Is the start frame of time zone. |
|
End Frame |
Is the end frame of time zone. |
|
Update Frame Setting |
The frame setting is updated with this option. Note: If Use Recommend Time Zone is unchecked, it must be used before you proceeds. |
|
FrameSettings |
Use Recommend Frame Settings |
Select the frame size based on the signal information automatically. The system then locates and enters the minimum residual data count for the frame count, which is equivalent to 1/4 count of the frame size. This is determined based on the resolution and half as much frame size is produced as the frequency data. Wherever possible, the count for the X and Y data is also halved. |
Frame Number |
Specify frame number. |
|
Frame Size |
Specify the data count for each frame. |
|
RPM Compute |
Calculate the representative RPMs for each frame using the average or min/max values. |
|
Frame Length (sec) |
Specify the time length of each frame. |
|
Overlap (%) |
Specify the percentage of overlapping data between neighboring frames. |
|
Residual Number |
Specify the number of data after a decimal point in the remaining data value. |
|
Delta Time |
Delta time is defined as multiplying an integer proportional value multiplying by the input sampling time. Therefore, the integer value shows and can be changed. This option allows to use the partial data among the extracted data rather than all of the data. You can use this option when having a very long time period, but the response frequency is low. |
|
AdvancedSettings |
Signal Offset |
The signal offset method setting configures the offset for the signal frequency response to time. This function adjusts the frequency using the 0 set. This prevents problems that occur during overall tendency analysis when the low-frequency signal produces too large a value for the 0 frequency. Signal average to zero: Subtracts the average value of the entire signal data from the signal data and uses the remaining value to offset the signal data. Frame average to zero: Subtracts the average value of the frame from the frame data and uses the remaining value to offset the signal data when it contains the low-frequency signal. 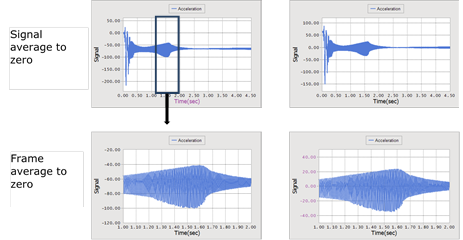
|
Window Type |
Since the signal format for the FFT signal handling cannot begin from 0 and end in 0, you can use the Window function to adjust the signal format. RecurDyn includes the following Window functions. 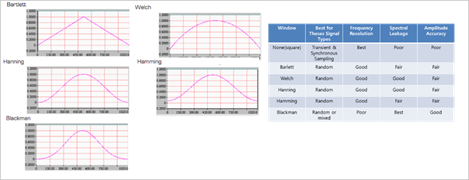
|
|
Magnitude Type |
The magnitude of the resulting value calculated through the FFT can be expressed as an amplitude, power spectrum or power spectrum density. You can use the following formulas to calculate these values. Amplitude: Mean square of the real number and imaginary number. 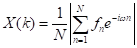
Power Spectrum: Square spike 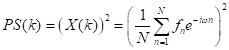
Power Spectrum Density: This is a magnitude, so calculate it as though the energy of time data and energy of frequency data have the same physical quantity when the signal is speed. (For general PSD, df is not multiplied, but it is multiplied to express the area of each frequency in the mechanical field.) 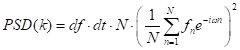
|
|
Calculation |
Campbell diagram is calculated using updated signal information and frame settings. It must be used before you proceeds. |