9.10.1.3. Band Option
Color Set Type: Selects a type to full colors in the contours. (The default is Spectrum.)
Spectrum: Colors involves using a color scale, typically a rainbow-colored palette.
Gradation: Colors involves assigning different hues of colors to contours at regular intervals.
Min Color: Minimum color (The default is Blue)
Max Color: Maximum color (The default is Red)
Band level: Defines a band level. (The default is 10.)
The band level ranges from 2 to 60. Raising band level, you can have more colorful contour.
Enable Log Scale: Enable to display contour data as Log scale.
The log scale used in contour is basically using symlog to express continuous colors for negative values. In addition, it is linearly transformed in the [-10, 10] range and logarithmically transformed in the rest of the range.
Customize: Enable to customize band option.
Band Option: Customize the values and colors of bands using dialog.
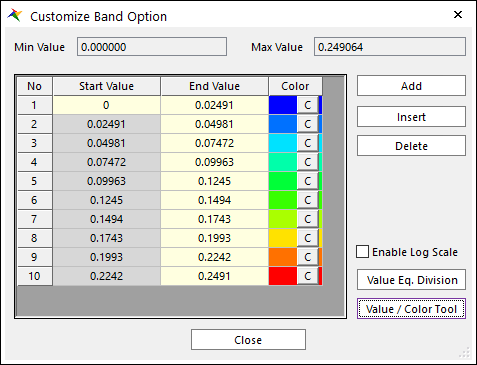
Figure 9.156 Customize Band Option Dialog
Min Value / Max Value: minimum and maximum values of the contour data to be used as reference.
Add / Insert / Delete: Add row / Insert row / Delete row
Enable Log Scale: Enable to display contour data as Log scale in customize band option
Value Eq. Division: Divide equivalently base on the number of row, minimum value and maximum value in grid
Value / Color Tool: customize values and colors in grid using dialog.
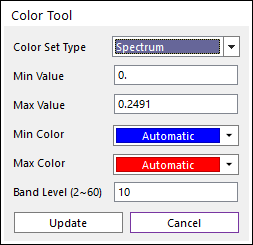
Figure 9.157 Color Tool Dialog