5.8.3. Example
Application Model (suspension.rdyn)
Figure 5.78 Model File
Note
If the user wants to run this model using Design Parameter Study, the user can refer it in the directory (<install dir>\Help\DP_Study\**).
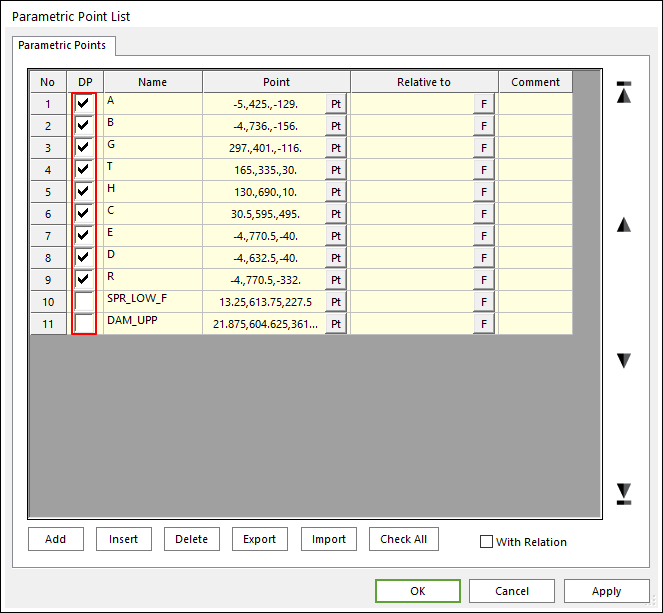
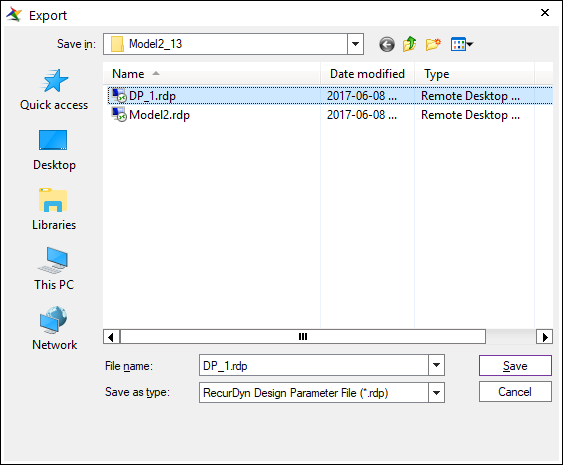
Export Design Parameter File
Export the RSS File
Define the Scenario file: Refer to Scenario Files.
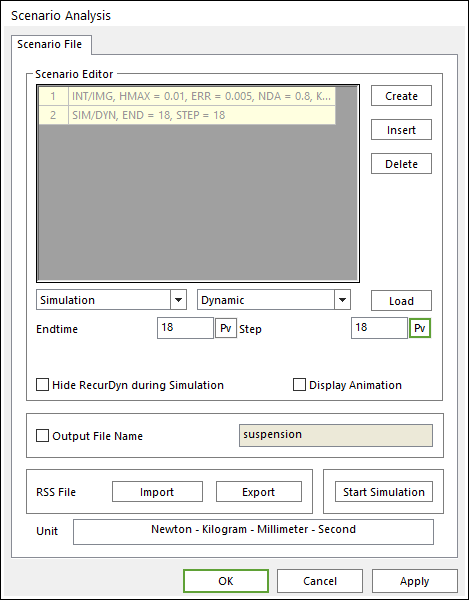
Figure 5.81 Scenario Analysis dialog box
Export the *.rss file.
File Name: DP.rss
INT/IMG,
HMAX = 0.01, ERR = 0.005, NDA = 0.8
SIM/DYN, END = 18, STEP = 18
STOP
Create the Batch File
Refer to Batch Simulation and Convert Design Parameter.
File Name: DP.bat
mkdir out
ConvertDP /convert Dp_1.rdp T=165,335,28"
<install dir>\bin\recurdyn.exe" "suspension.rdyn" /rdp DP_1.rdp /rssDp.rss /out out\out1 /show
ConvertDP /convert Dp_1.rdp T=165,335,30"
<install dir>\bin\recurdyn.exe" "suspension.rdyn" /rdp DP_1.rdp /rssDp.rss /out out\out2 /show
Change the value of the T by using the ConvertDP.exe
165,335,28 -> 165,335,30
Execute the Batch File
Double-click DP.bat. The result files are created in the ‘out’ folder.
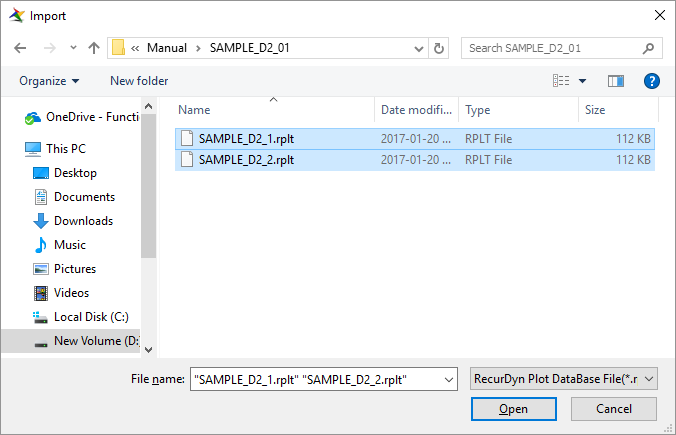
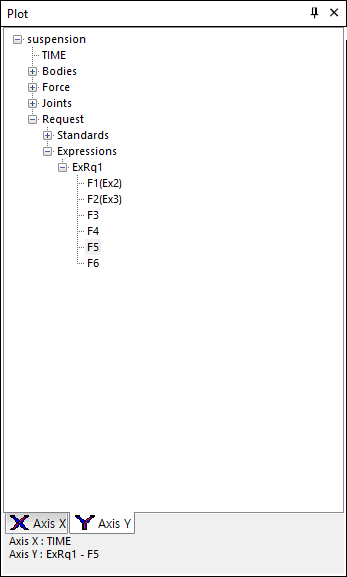
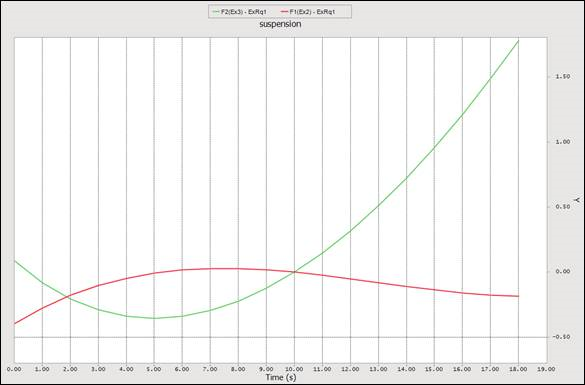
Plotting