19.2.2.6. MetaModel
MetaModel supports making table data of gear force and use it in the dynamic analysis. Additionally, user can check and display gear force table data through 3D plot.
19.2.2.6.1. MetaModel
MetaModel is a method to make table data of gear force and use it for dynamic analysis. There are 6 variables (Rotational Angle, Penetration, Distance Error, Axial Offset, Twist, Tilt) with which we can define gear pair geometry. User can define data points for each variable and then consist of gear force table data for all data points of selected variables in binary file having gmm extension. From the geometry of the gear pair at a specific time, RecurDyn/Solver performs dynamic analysis by calculating the value of 6 variables and then obtaining gear force from the table data of *.gmm file using computed value of 6 variables.
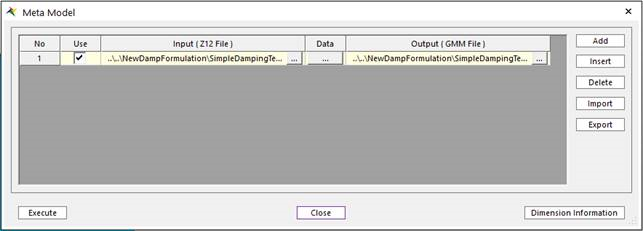
Figure 19.51 Properties of MetaModel dialog box
Use: select z12 file in order to make *.gmm file
Input (Z12 File): load z12 file in order to make *.gmm file
Data: Configure the table data points for 6 variables.
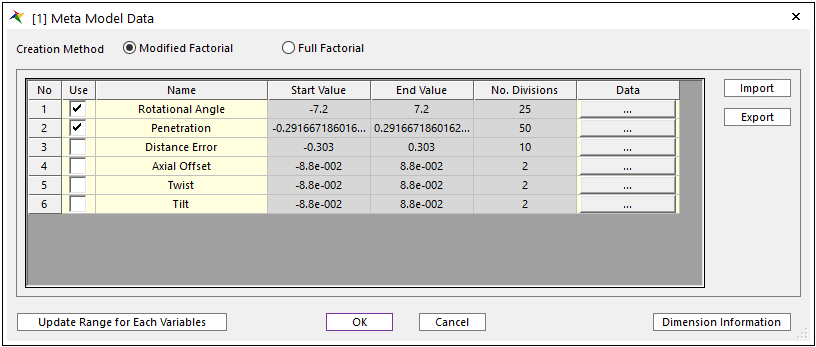
Figure 19.52 Table Data dialog for Meta Model
Creation Method
Modified Factorial: User can make gear force table data for necessary data points of selected variables.
Full Factorial: User can make gear force table data for all data points of selected variables.
Start Value, End Value, No, Divisions using Data tab: user can make coordinates for each variable using Data tab.
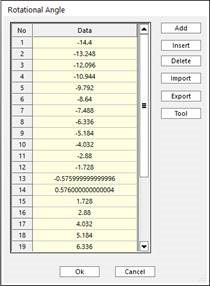
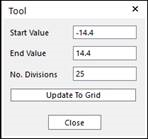
Figure 19.53 Definition of Bounding Buffer Length
Add: Add a data point
Insert: Insert a data point at arbitrary position.
Delete: Delete a data point.
Import: Import *.csv file including coordinate information.
Export: Export *.csv file including current coordinate information.
Tool: Set start value, end value and number of divisions in order to make uniform coordinates.
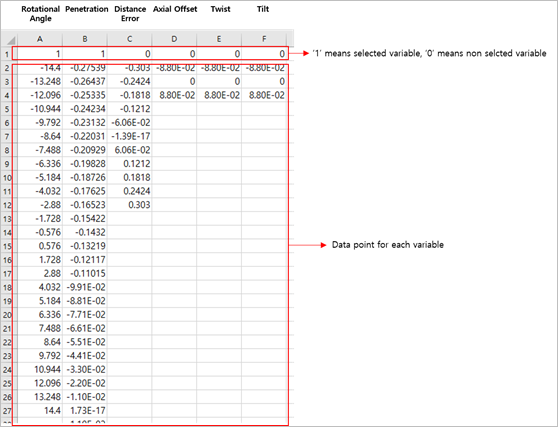
Figure 19.54 *.csv file for table data
Import: User can import table data by *.csv file.
Export: User can export table data to *.csv file.
Update Range for Each Variables: If variable range for meta model is not proper, user can get the warning message when the closing the ‘Meta Model Data’ dialog through ‘OK’ button. Then. user need to update variable range by clicking this button.
19.2.2.6.1.1. Definition of Input Variables
In the meta model, 6 variables are used in order to represent gear pair geometry.
Rotational Angle (ɸ)
It represents rotational angle of gear1(base body). It has the range from -pitch angle to +pitch angle.
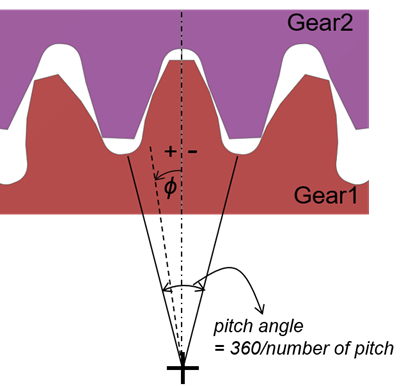
Figure 19.55 Definition of Rotational Angle
Penetration (δ)
It indicates the degree to which gear2 travels further based on the state of transmission error being zero. It is a unit of length and is defined by multiplying the angle of rotation by the pitch radius of gear2. It has a positive value when rotated by the + z axis (upward direction in the drawing).
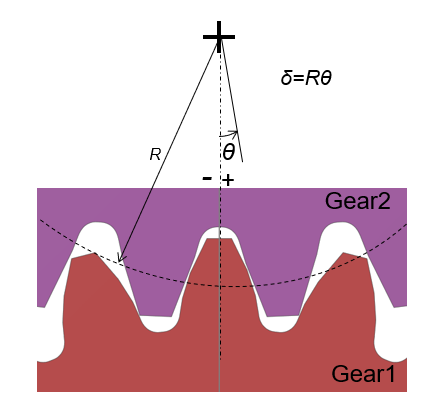
Figure 19.56 Definition of Penetration
Distance Error (ɛ)
It represents variation from initial center distance.
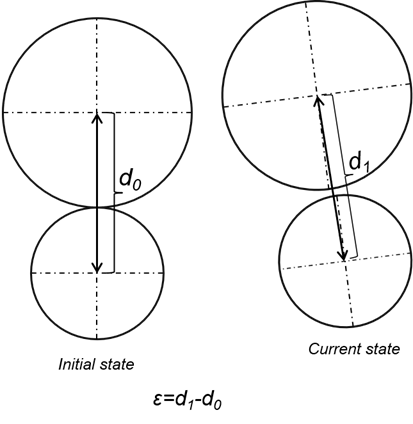
Figure 19.57 Definition of Distance Error
Axial Offset (bv)
It represents the offset value of gear2 relative to gear1 in axial direction. The offset in the direction opposite to the z-axis of gear1 has a positive sign.
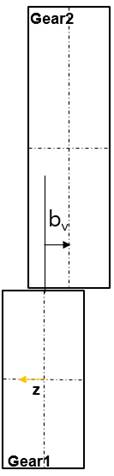
Figure 19.58 Definition of Axial Offset
Twist (β)
Looking down for the gear pair, it shows how much gear2 rotates relative to gear1. The twist value generated by rotation of gear2 in the upward direction in the drawing has a negative sign and the opposite rotation has a positive sign.
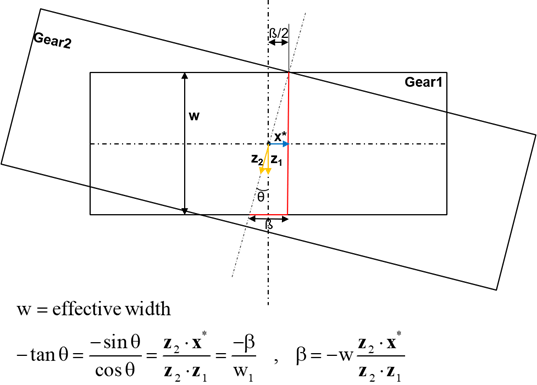
Figure 19.59 Definition of Twist
Tilt (ζ)
When you look at the gear pair from the right side, it shows how much gear2 rotates relative to gear1. The tilt value generated by rotation of gear2 in the upward direction in the drawing has a positive sign and the opposite rotation has a negative sign.
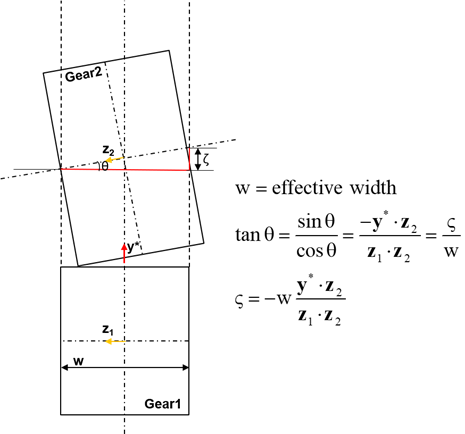
Figure 19.60 Definition of Tilt
Note
19.2.2.6.2. 3D Plot
3D Plot is a tool in order to display 3D plot for gear force component in *.gmm file. User can see the 3D plot of the gear force component according to the 6 variables (rotational angle, penetration, distance error, axial offset, twist, tilt) representing gear pair geometry.
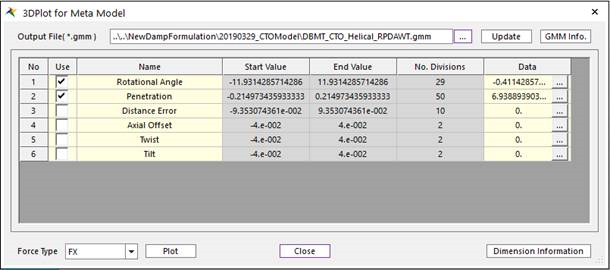
Figure 19.61 Properties of 3DPlot for Meta Model dialog box
Output File(*.gmm): Load *.gmm file in order to display 3D plot.
Update: Update coordinate information for each variable.
GMM Info.: Information about gear pair geometry of *.gmm
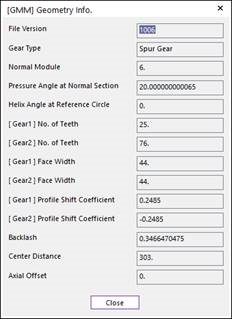
Figure 19.62 Geometry Info. dialog for gear pair of *.gmm file
Use: select two variables to use as coordinates in 3D plot.
Data tab: For variables other than two coordinate variables for 3D plot, one coordinate must be specified. You can specify this in the data tab. The default setting is the middle value.
Force Type: user can select force component for 3D plot.
Plot: Display 3D plot by clicking it.
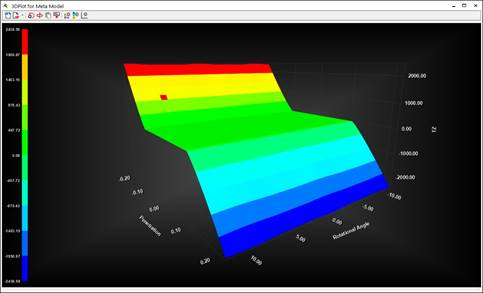
Figure 19.63 Example of 3D plot