14.3.6. Safety Factor
The user can use fatigue safety factor to evaluate fatigue strength and predict whether any part of the structure ever fails in the design life due to cyclic loading in an event. RecurDyn/Durability supports the Goodman, Gerber and Modified Goodman methods.
Goodman & Gerber
The calculation method for the safety factor (SF) is as follows:
Both stress amplitude and mean stress are varying:
Goodman: \(\frac{1}{SF}\,\,=\,\,\max \left( \frac{\sqrt{1-\gamma +{{\gamma }^{2}}}{{\left( \frac{\Delta \sigma }{2} \right)}_{i}}}{\frac{\Delta S}{2}}+\frac{\left( 1+\gamma \right){{\left( {{\sigma }_{m}} \right)}_{i}}}{{{S}_{u}}} \right)\)
Gerber: \(\frac{1}{SF}\,\,=\,\,\max \left( \frac{\sqrt{1-\gamma +{{\gamma }^{2}}}{{\left( \frac{\Delta \sigma }{2} \right)}_{i}}}{\frac{\Delta S}{2}}+{{\left( \frac{\left( 1+\gamma \right){{\left( {{\sigma }_{m}} \right)}_{i}}}{{{S}_{u}}} \right)}^{2}} \right)\)
- Where,
- \(\frac{\Delta \varepsilon }{2}\) ∶ Normal strain amplitude for a cycle\(\gamma\) ∶ Bi-axiality ratio\(\sigma _{m}^{{}}\) ∶ Mean stress for a cycle\(S_{u}^{{}}\) ∶ Ultimate tensile strength (material property)\(\frac{\Delta S}{2}\) ∶ Fatigue strength limit
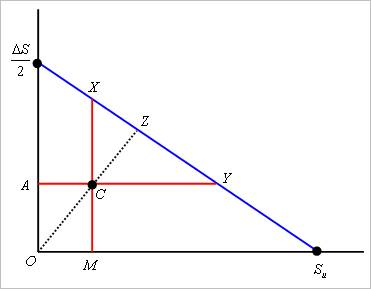
Figure 14.53 A schematic diagram for safety factor of Goodman.
And the safety factor can be calculated as follows:
Both stress amplitude and mean stress are varying:
\(SF = OZ/OC\)
- Where,
- \(C\) : Identified stress cycle\(M\) : Mean stress of the cycle\(A\) : Stress amplitude of the cycle\(S_{u}^{{}}\) : Ultimate tensile strength (material property)\(\frac{\Delta S}{2}\) : Fatigue strength limit or the endurance limit(Se)
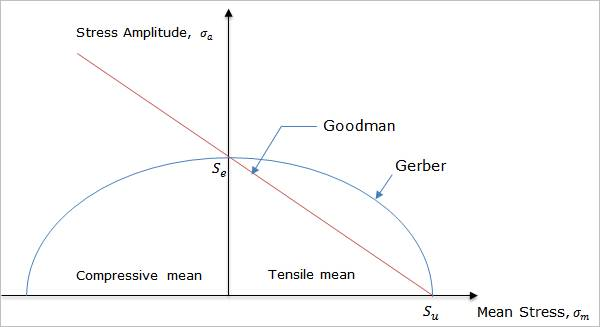
Figure 14.54 Comparison of two safety factor methods considering the compressive mean stress
Note
In order to calculate two Safety Factor types such as Goodman and Gerber, two parameters should be needed in the material properties. These are the Ultimate Tensile Strength and the Fatigue Strength Limit. At that time, if there is no the Fatigue Strength Limit information in material properties, the durability solver can be used the Cyclic Strength Coefficient in material properties instead of that.
Modified Goodman
In the case of Modified Goodman method, Haigh diagram is as shown in the Figure 14.55 below.
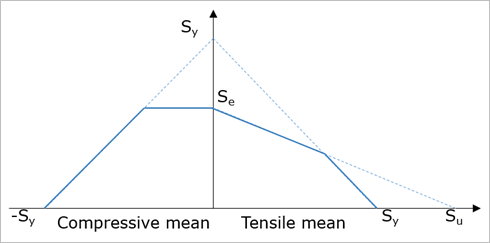
Figure 14.55 Haigh diagram for Modified Goodman method
- Where,
- \({{S}_{y}}\) : Yield strength (material property)\(S_{u}^{{}}\) : Ultimate tensile strength (material property)\({{S}_{e}}\) : Fatigue strength limit or the endurance limit (Se)
Unlike the Goodman method, this method can consider the yield strength of the selected material when calculating the safety factor as the upper figure. This can be called as an Augmented Modified-Goodman Diagram. At that time, this method supports only the material of which Cyclic Yield Strength or Fatigue Limit Stress should be less than Yield Stress. So, if the warning message has occurred when applying this method, the Fatigue Limit Stress should be defined less than the Yield Strength in the selected material property.
User-Defined Haigh diagram