5.15. Scope
The user can the graph output data using functions such as Angle, Point-to-Point, Function Expression, output of any model entity and Gap. As shown in the below figure, a scope coexists with an animation in the Working Window. When an animation is displayed, a vertical bar moves through the scope to indicate the value of the output at the time of the animation frame. Note that the scope is not included when an *.mp4 file is created from the animation.
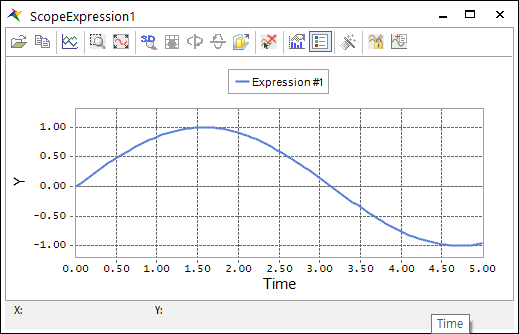
Figure 5.114 Scope
Import/Export: Imports and exports the measured data.
Copy to Clipboard: Exports in different formats, including the Bitmap, Metafile and Text (data only).
Gallery Style: Applies various chart types, widely used Line, Curve, Scatter, Area, Area-Curve, Bar and Step.
Zoom: Uses zoom effects.
Fit
3D/2D: Shows the 2D or 3D and rotated to specific angles and perspectives.
Rotated View
Rotate Around Y Axis
Rotate Around X Axis
Clustered(Z-Axis)
Delete selected Curve
Axes Settings: Sets up more options, please double click each axis.
Y Axis: Set up Grid and Interlaced.
X Axis: Set up Grid, Vertical Labels, Staggered and Show Labels.
Legend Box: Shows the Legend Box on the Chart.
Properties: Generalizes the Chart Toolbar. Refer to Plot.
Hold previous data: Holds the previous plotting data.
Add To Plot: Shows the scope data based on the reference frame as User Data in Plot.
Note
If you click the Add To Plot icon when the Plot window is not floating, the scope data is displayed as User Data in the Plot database of the new Plot window. If you click the Add To Plot icon when the Plot window is floating, the scope data is displayed as User Data in the Plot database of the most recent Plot window.
Useful Tips
The user can use Display option through the Database.
Select Scope entities.
Click Display on right-click menu.
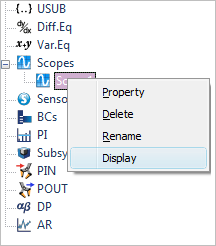
Figure 5.115 Display on right-click menu