8.1.15. Series Information Window
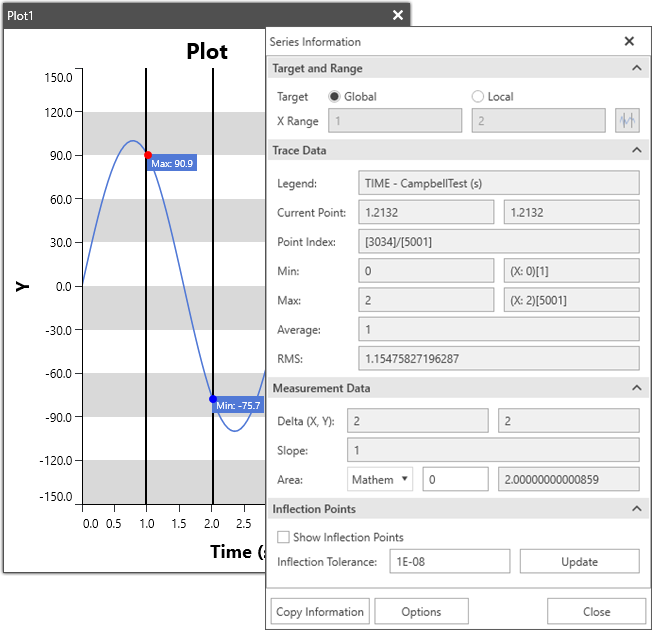
Series Information Window allows you to read the index, coordinates, Min value, Max value, Average value, and RMS value of a data. When the mouse cursor is moved in the X-Axis direction, data of the selected series corresponding to the vertical line of the mouse cursor will be displayed.
Target and Range |
Target |
Set target among the Global and Local. |
X Range |
Set the area with the specific two vertical line for the inspection area. |
|
Trace Data |
Legend |
Display the legend of the selected series. |
Current Points |
Display the data values on vertical line of the mouse point. |
|
Point Index |
Display the index of data values. |
|
Min |
Display the minimum value and index for the global or local. |
|
Max |
Display the maximum value and index for the global or local. |
|
Average |
Display the average for the global or local. |
|
RMS |
Display the RMS (Root Mean Square) value for the global or local. |
|
Measure Data |
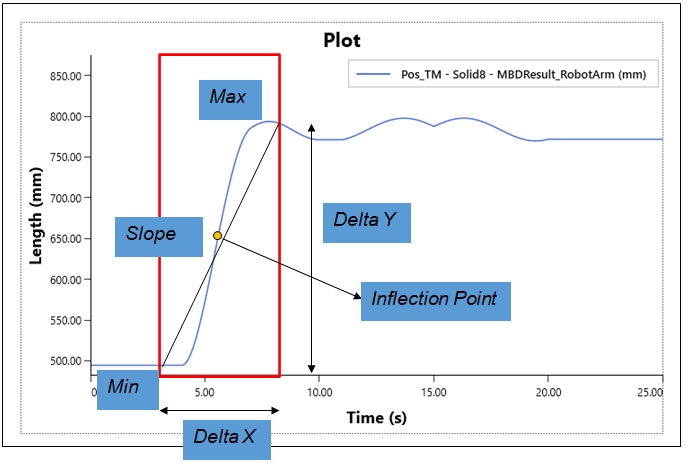
Delta (X, Y) |
Display the delta values. |
Slope |
Display the slope value. |
|
Area |
Display the area value. There are two options for calculating the area. One is mathematical, another is absolute. |
|
Inflection Points |
Show Inflection Points |
Show inflection points. They are displayed as square for selected series. |
Inflection Tolerance |
Set the tolerance for inflection points. If the second derivative value is less than the tolerance, that inflection point will be ignored when calculating inflection points. |
|
Copy Information |
Copy the series in formation to clipboard. |
|
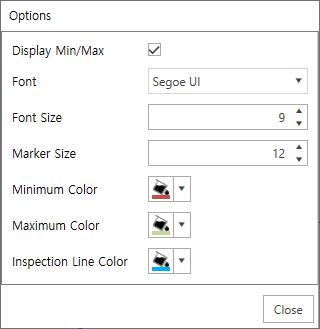
Options |
Show the Options window. The display settings can be set by the Options window.
|