14.2.2.11. Fatigue Tools
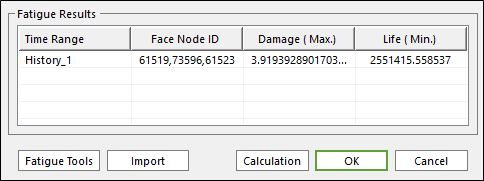
Figure 14.34 Fatigue Tools in the Fatigue Evaluation dialog
In Fatigue tool, user have to select the patch that user want to check and then adjust the direction for calculating fatigue result on the patch. After the patch and the direction for calculating fatigue result is defined, user can check fatigue result easily under the condition. Additionally Rainflow Counting and Plot History are supported for the fatigue result. It is located in the bottom of the Fatigue Evaluation dialog as in the Figure 14.34. The Rainflow Counting results can be shown in an Excel spreadsheet as a 3D chart with the stress/strain range, the mean stress/strain and the number of cycles. And, Plot History shows the raw stress/strain time history. The button for Fatigue Tools is available after evaluating the fatigue results as shown above.
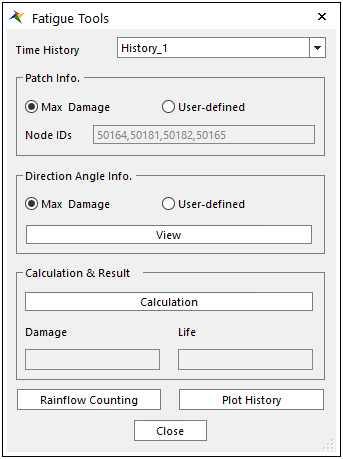
Figure 14.35 The Fatigue Tools dialog
Patch Info: Selects patch needed to be check fatigue result. At that time, the section of Node IDs shows the information about nodes ID number composing the patch.
Max Damage: Find the patch which has max damage automatically.
User-Defined: Select the patch that user want to check by clicking Sel.
Direction Angle Info.: Define the direction in which user want to check fatigue result on the selected patch.
Max Damage: Find the direction in which max damage occurs on the selected patch.
User-Defined: Adjust the direction in which user want to check the fatigue result by input angle for tangential direction on the selected patch. The direction is displayed by clicking View button. Please refer to Figure 14.36.
Calculation & Result: By clicking ‘Calculation’ button, calculate fatigue result such as damage, life or safety factor based on the defined conditions and display it.
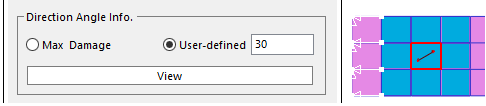
Figure 14.36 The direction for fatigue calculation by input angle for tangential direction
Rainflow Counting
The rainflow counting results under the defined conditions can be shown in an Excel spreadsheet automatically by clicking Rainflow Counting in Fatigue Tools dialog as shown in the Figure 14.35 above.
In the Excel spreadsheet, it is possible for user to see easily the stress/strain range, the mean stress/strain and the number of cycles from the defined time history a 3D chart. In addition, the raw data to draw the chart can be shown like the Figure 14.37.
If the multi-time history sets are defined on Time History of the Fatigue Evaluation dialog, it is possible to see the Rainflow Counting results according to each time set by selecting a time set in Time History of the Fatigue Tools dialog.
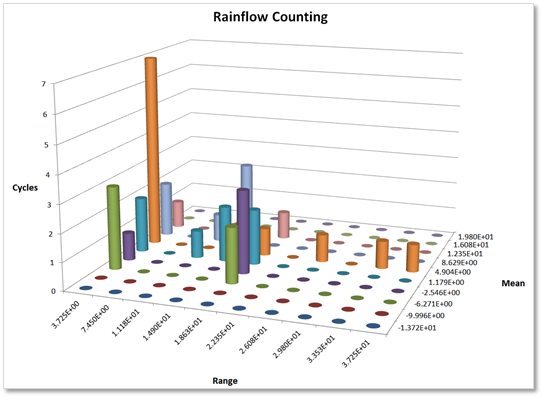
Figure 14.37 The Rainflow Counting results in a 3D chart
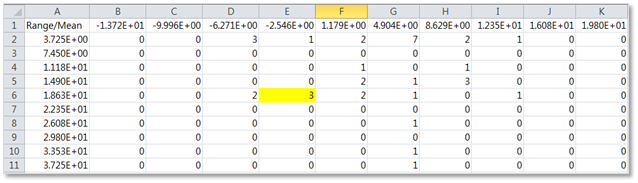
Figure 14.38 The raw data to draw a 3D chart
Note
The Rainflow Counting function can be supported the Excel 2010 version and the later version.
Plot History
Plot History shows the raw stress/strain time history under the defined conditions. The time history can be shown by clicking Plot History in Fatigue Tools dialog as shown in the Figure 14.39 below. After that, the plot results show as like the Figure 14.40.
Figure 14.39 The Plot History in the Fatigue Tools dialog
If the multi-time history sets are defined on Time History of the Fatigue Evaluation dialog, it is possible to see the raw stress/strain time history according to each time set by selecting a time set in Time History of the Fatigue Tools dialog.
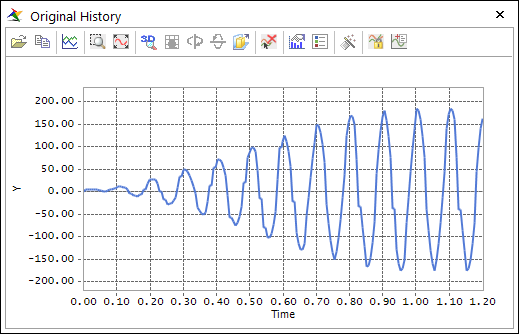
Figure 14.40 The Original History results
For reference, the Original History results that consist of the stress or strain results based on time is generally used for performing Rainflow Counting. So, if you want to check the Rainflow Counting results or to validate the fatigue results, this plot results help you to understand.