18.2.3. Result
You can check the result of the Iteration simulation of the TSG.
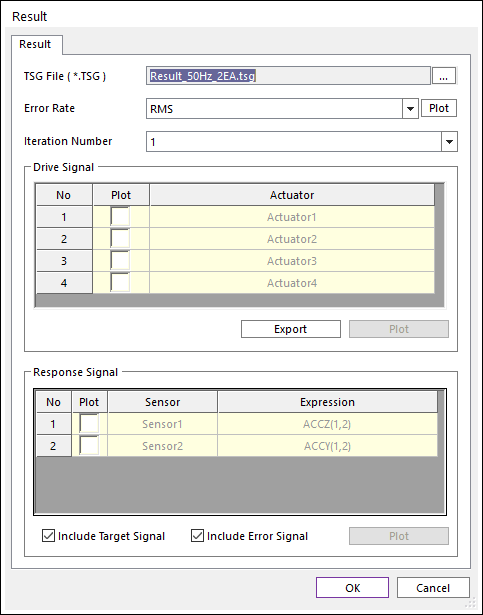
Figure 18.34 Result dialog box
TSG File (*.TSG): Selects “*.TSG” result file by clicking ….
Error Rate
Plot: User can check the following four Error Rate on each Iteration Number.
The error for any sensor i at time t can be defined as:
(18.7)\[{{e}_{i}}\left( t \right)={{T}_{i}}\left( t \right)-{{S}_{i}}\left( t \right)\]Where, \({{S}_{i}}(t)\): The signal of sensor i at time t. \({{T}_{i}}(t)\): The target signal for sensor i at time t.
The average signal \({{S}_{i,average}}\) and average target signal \({{T}_{i,average}}\) for any sensor i can be defined as :
Where, \(nData\): The number of data for each sensor (=End time x Sampling frequency + 1).
The root mean square signal \({{S}_{i,RMS}}\), target signal \({{T}_{i,RMS}}\), and error rate \({{e}_{i,RMS,rate}}\) for any sensor i can be defined as:
(18.8)\[{{S}_{i,RMS}}=\sqrt{\sum\limits_{d=1}^{nData}{\frac{{{({{S}_{i}}({{t}_{d}})-{{S}_{i,average}})}^{2}}}{nData}}}\](18.9)\[{{T}_{i,RMS}}=\sqrt{\sum\limits_{d=1}^{nData}{\frac{{{({{T}_{i}}({{t}_{d}})-{{T}_{i,average}})}^{2}}}{nData}}}\](18.10)\[{{e}_{i,RMS,rate}}=\left| \frac{{{S}_{i,RMS}}-{{T}_{i,RMS}}}{{{T}_{i,RMS}}} \right|\]From this, the following error terms can be derived:
Table 18.1 Error Rate Error Term
Equation
RMS
\(\sqrt{\frac{\sum\limits_{i=1}^{nSensors}{\sum\limits_{d=1}^{nData}{e_{i}^{2}({{t}_{d}})}}}{n}}\)
Max
max(\(\left| {{e}_{i}}({{t}_{d}}) \right|\)) for any \(i\in \{1,\ldots ,nSensors\}\) and \(d\in \{1,\ldots ,nData\}\)
Min
min(\(\left| {{e}_{i}}({{t}_{d}}) \right|\)) for any \(i\in \{1,\ldots ,nSensors\}\) and \(d\in \{1,\ldots ,nData\}\)
Average
\(\frac{\sum\limits_{i=1}^{nSensors}{\sum\limits_{d=1}^{nData}{e_{i}^{{}}({{t}_{d}})}}}{n}\)
RMS ErrorRate
\(\sum\limits_{i=1}^{nSensors}{\frac{{{e}_{i,RMS,rate}}}{nSensors}}\)
Where, \(n\): The total number of data for all sensors (= Number of sensors x (End time x Sampling Frequency + 1) ).
Iteration Number: User can select the Iteration Number.
Drive Signal
Plot check box in list view
Export: User can make a “*.TAI” or “*.CSV” file including the drive signals.
Plot: User can see the signal data on the opened scope dialog.
Response Signal
Plot check box in list view
Include Target Signal: If this check box is checked, then the Target signals is added in the plot.
Include Error Signal: If this check box is checked, then the error signals (=Target(t) – Sensor(t)) is added in the plot.
Plot: User can see the signal data on the opened scope dialog.