21.2.1.5. Statistical Analysis
Let’s consider a typical process of statistical analysis from Figure 21.3. The preassigned parameters such as Load P and material property E can have some variations. They can be represented as mean value +/- deviations. Also, length, width (b) and height (h) have manufacturing tolerances. All these values, represented by mean and deviation, are called ‘Random values’. Deterministic values are opposite to them. That is, Deterministic values have no deviations, which may be ideal values.
Let’s study the process of statistical analysis. Suppose that mean values of noise factors and random design variables are fixed. Then, select the random sampling points within the fixed means +/- deviations ranges and evaluate the system analysis according to the sampling set. Finally, evaluate the mean responses and their standard deviations from the analysis result set. When mean values of random design variables are changed, those processes are repeated. Thus, statistical analysis requires many evaluations.
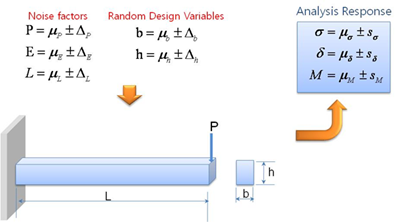
Figure 21.3 Statistical analysis