14.2.3. Contour
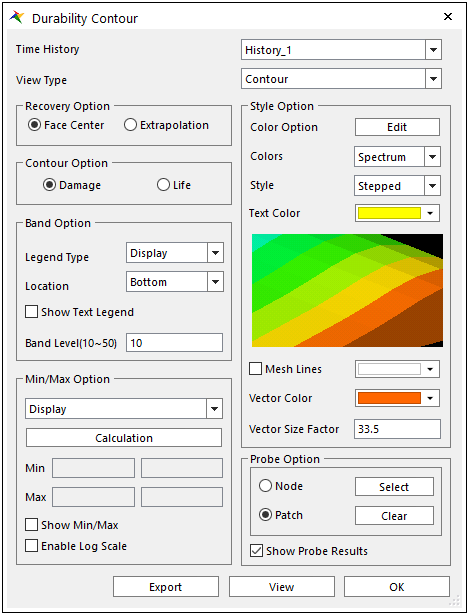
Figure 14.41 The Durability Contour dialog
Time History: Selects the name of the time history when the multi-time history sets are defined on Time History of the Fatigue Evaluation dialog.
View Type: Supports three types of Contour, Damage Vector, Contour & Damage Vector, Mean Stress or Stress Amplitude. In the case of contour plot, it depends on data evaluation position according to Recovery Option.
Contour: Displays only the contour plot about the fatigue results such as Fatigue Damage, Fatigue Life and Safety Factor.
Damage Vector: Displays only the damage direction vector as arrows on the element free face of the defined patch or element sets.
Contour & Damage Vector: Shows both the contour plot and the damage vector as shown in the Figure 14.42 below.
Mean Stress: Displays contour plot for the mean stress at the damage cycle having lowest safety factor. This option is only available when Contour Option is safety factor.
Stress Amplitude: Displays contour plot for the stress amplitude at the damage cycle having lowest safety factor. This option is only available when Contour Option is safety factor.
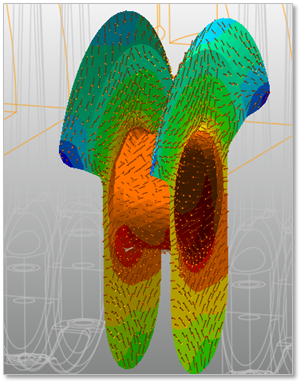
Figure 14.42 Contour & Damage Vector results
Recovery Option: Selects Face Center or Extrapolation..
Face Center: Fatigue results are evaluated at the center of face.
Extrapolation: Fatigue results are evaluated at the center of face and then it is exptrapolated to each node.
Contour Option: Selects Damage or Life. If user calculates safety factor, safety factor is only available.
Band Option: Sets about a legend. For more information, click here.
Min/Max Option: Sets about Min/Max values. For more information, click here.
Enable Log Scale: Displays the contour data in the log scale. This option can be useful when the user selects the Life contour option.
It is very useful to check the result pattern of fatigue life. Because the value difference between the maximum value and the minimum value is so large, it is necessary to use the log scale when the user sees the results in Contour.
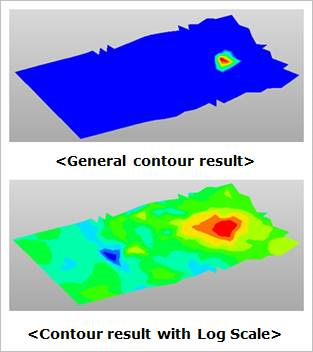
Figure 14.43 the Enable Log Scale results
Style Option: Sets a style of contour. For more information, click here.
Vector Color: Defines the color of the arrow when selected Damage Vector or Contour & Damage Vector in the View Type section.
Vector Size Factor: Defines the size of the arrow when displaying the damage vector on the patches.
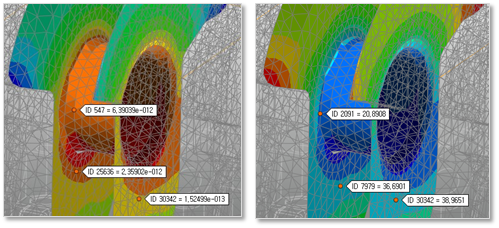
Probe Options: Shows the tooltip to see the value of fatigue results
Select Node/Patch: Navigates nodes or patches on the element or patch set.
Clear Node/Patch: Deletes all the tooltips in the working window.
Show Probe Results: Displays always the all tooltip results when selecting this checkbox.
Contour View
Displays the current contour data with selected contour setting options.