5.7.1. Property
5.7.1.1. Design Variable Page
In this tab, you create DOE tables. before setting this table, Design Variables should be defined. Refer to Design Variable.
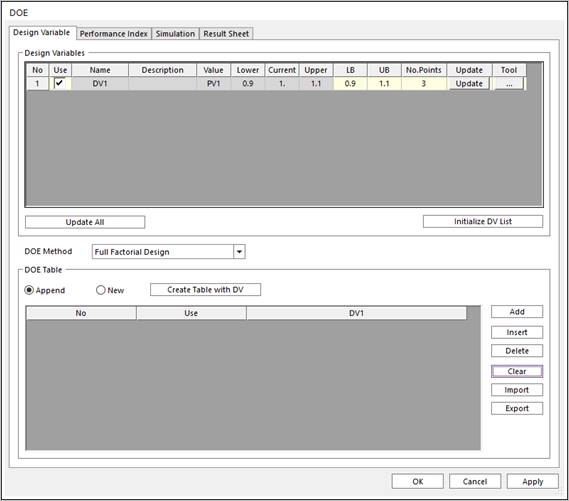
Figure 5.50 Design Variable page in DOE sheet
Use: If this option is checked, it used to create DOE Table.
LB: Lower Bound.
UP: Upper Bound.
No.Points: The number of points.
Update: Update the changed contents in the grid.
Tool: Tools to help create points. If you set LB, UB, and the number of points, points are created according to the values.
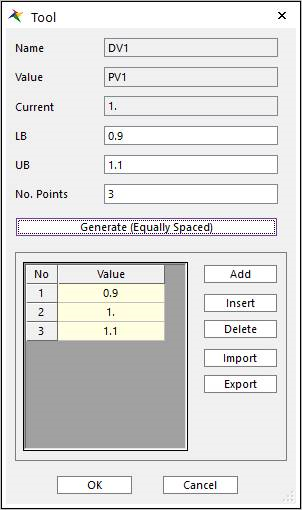
Figure 5.51 Points Generating Tool
Update All: Update all the changed contents in the grid.
Initialize DV List: Initialize to original DV value.
DOE Method: Select the DOE Method. For more information click here. The total number of DOE tables cannot exceed 1 million.
Create Table with DV: create DOE table that contained simulating case. And check the use combo box between Append and New for the actual simulation cases.
5.7.1.2. Performance Index Page
In this page, you check the list of defined PIs. before setting this table, Performance Indexes should be defined. Refer to Performance Index.
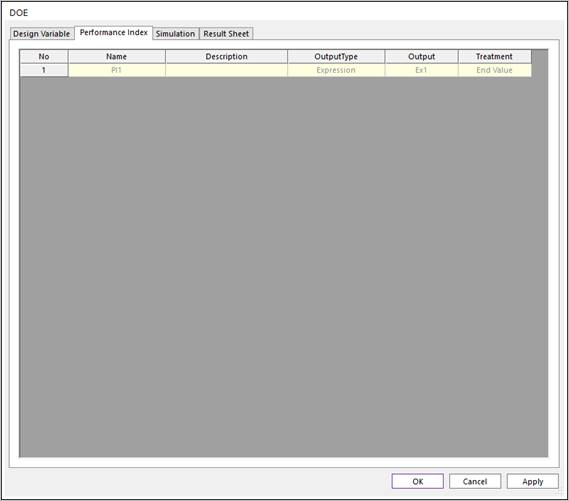
Figure 5.52 Performance Index page in DOE sheet
5.7.1.3. Simulation Page
In this page, you can perform DOE analysis.
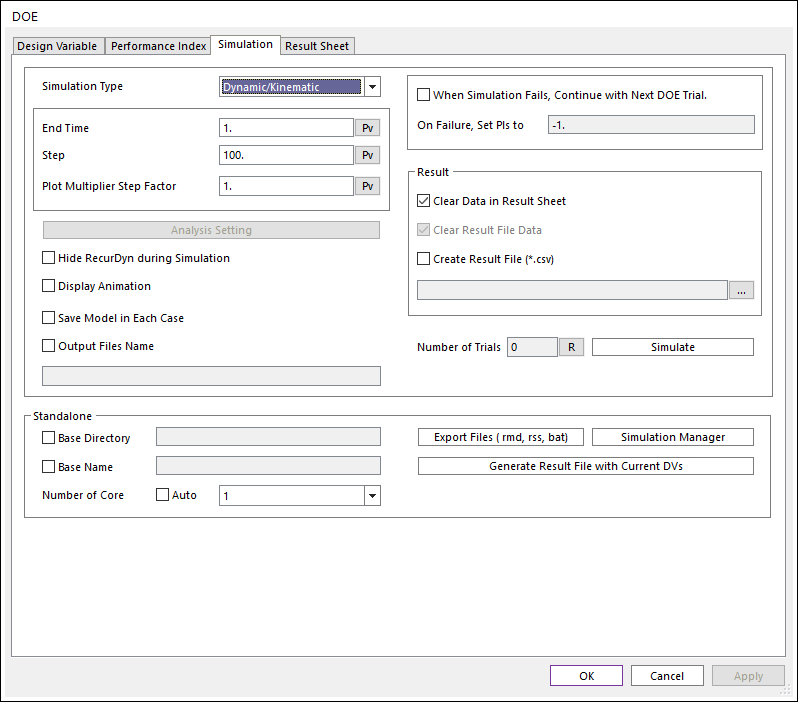
Figure 5.53 Simulation page in DOE sheet
Simulation Type: Select simulation type between Dynamic/Kinematic and Static. Functions supported by each analysis type can be checked in the corresponding analysis.
Analysis Setting: Defines the Static Analysis Parameter.
Save Model in Each Case: Save he each model with used Parametric Value for simulation.
Output Files Name: Set the output files name.
When Simulation Fails, Continue with Next DOE Trial: The simulation does not stop, when simulate fails. And the simulation is continued to the next DOE trial.
On Failure, Set PIs to: Set on the Result Sheet as a performance index’s value when the simulation fails. Only numbers can be inputted.
Clear Data in Result Sheet: Clear result data in result sheet before reporting.
Clear Result File Data: When creating a result file, delete the existing file data.
Create Result File: Create a result file with the set name.
Number of Trials: This is the number of simulations executed based on DV Table Data and can be updated through the Refresh button.
Standalone: You can perform DOE analysis by using Stand-alone solver.
Base Directory: Root directory of DOE model files.
Base Name: Prefix name of the file related to the created model.
Number of Core: The number of Solver Cores defined in the RMD file can be defined. This value is separate from the value in the Simulation Settings and is applied only when exporting RMD from DOE. Since this value has a great influence on the analysis performance, it is necessary to set it according to the environment.
Export Files (RMD, RSS, BAT): Export RMD and RSS files including PI information. In addition, a batch file that can simulate all models by batch command is created.
Simulation Manager: Utility execution that supports multi-simulation execution. (If base directory is set, automatically add cases). Refer to Simulation Manager.
Generate Result File with Current DVs: Create the result file with rpi information under the base directory. (The RPI file supports only expression type)
5.7.1.4. Result Sheet Page
After finishing DOE analysis, you can see the simulated result, and the functions to analyze the result with a chart is also supported.
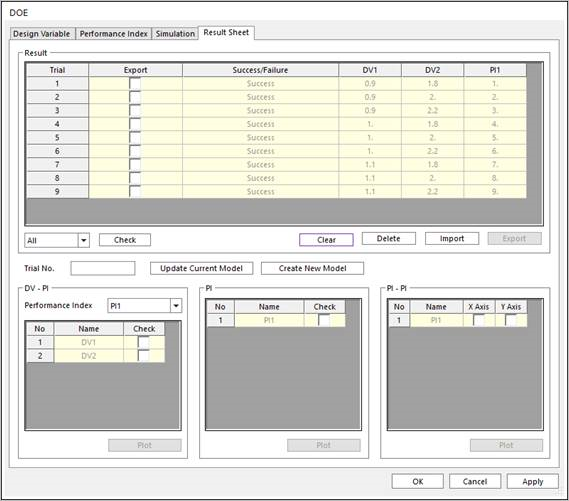
Figure 5.54 Result Sheet pabe in DOE sheet
Check: If you select the combo box (All/Failure/Success) and click the check button, only the relevant item is checked.
Import: Import the result file. However, the DV and PI values must match.
Export: Export the result file.
Update Current Model: Update the current model as set in the Trial No.
Create New Model: Create the new model as set in the Trial No.
DV-PI Plot: Chart of PI values corresponding to DV values.
PI Plot: Chart of PI values.
PI-PI Plot: Chart showing two selected PI values on the defined axis.