7.3. Chart Properties
You can set properties for a chart sheet.
7.3.1. General
You can change Chart Settings.
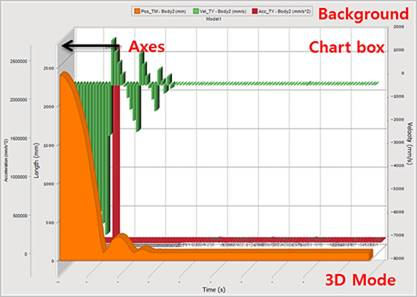
Figure 7.82 General Settings of Chart
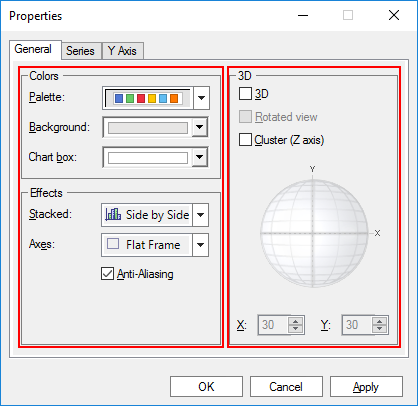
Figure 7.83 General tab of the Chart Properties dialog box
Colors Settings
Palette: Essentially, Palettes are a group of colors that apply to the different elements in the chart. When a palette is changed, all the elements that have not been forced to have a specific color adapts to the new palette.
Background: Changes the background color outside the Chart box.
Chart box: Changes the background color inside the Chart box.
Effects Settings
Stacked: Stacked options apply only to Bar and Area charts. So before applying this property, you must make sure the previous series and the selected series are of the same type (Bar or Area).
Side by Side
Stacked
Stacked 100%
Axes: Sets the axes style.
None: No frame is displayed around the axis.
3D Frame: A 3D frame is shown as the axis.
Math: Only tickmarks is shown as the axis.
Flat Frame: A single, flat frame is displayed in the axis.
Anti-Aliasing: Antialiasing is a technique for diminishing jagging (stair step) like lines that should be smooth.
3D Mode Settings
Rotated view: Rotates around X or Y Axis to specific angles and perspectives. This property can only be used when the chart is in 3D view. To avoid jagged lines, we recommend you use prominent angles (for example: 0,30,45,60,90, etc).
Cluster(Z axis): Displays a z-clustered 3D chart. When setting this property, you must make sure the chart is displayed in 3D mode and that the chart is cluster capable (BAR or LINES chart).
7.3.2. Series
You can to change Chart Series Settings. The chart series are represented by groups of data points.
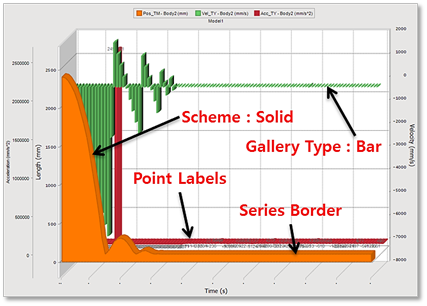
Figure 7.84 Series Settings of Chart
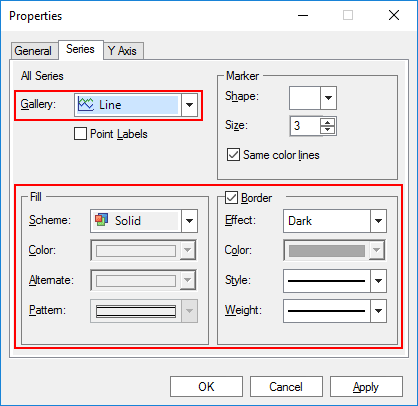
Figure 7.85 Series tab of the Chart Properties dialog box
Gallery Type Settings
Line: The line chart show trends in data at equal intervals and are effective for comparing highs and lows in a continuum. In a 2D line chart additional lines are drawn in the main chart area and, in the case of 3D line charts, lines could be displayed at the same level or clustered in the Z axis.
Curve: The curve charts use a spline algorithm to draw a curve between the points in the chart, rather than connecting the points directly with a straight line.
Scatter: The scatter plots (also called scatter diagrams or XY charts) are used to investigate the possible relationship between two variables that both relate to the same “event.” Each point in a XY Plot is defined by two coordinates (X, Y). This results in several important aspects regarding XY charts.
Area: The area charts are essential with the discontinuous breaks removed along the horizontal axis. Data is not broken into discrete bars but appears in a continuous ebb and flow as defined against the Y axis. Consequently, the area charts are particularly useful for emphasizing the magnitude of change over time. In addition, the area charts can be used for the same purposes as bar charts.
Area – Curve: The area charts are essential with the discontinuous breaks removed along the horizontal axis. Data is not broken into discrete bars but appears in a continuous ebb and flow as defined against the Y axis. Consequently, the area charts are particularly useful for emphasizing the magnitude of change over time. In addition, area charts can be used for the same purposes as bar charts.
Step: Rather than connecting the points with a straight line, these charts display one set of data as steps in a line. These charts are used to illustrate trends between more than two members of nominal or ordinal scales.
Fill Settings
Scheme
Solid: Solid Color.
Monochrome: Black & White patterns.
Pattern: Colored patterns.
Gradient: when painting the chart series
Border Settings
Apply various borders of the series/points.
Effect
None: No border effect is applied. The border effect must be None for the Border Color property to take effect.
Raised: The border has raised inner and outer edges.
Light: Applies a light color to the border using the series/points color.
Dark: Applies a dark color to the border using the series/points color.
Opposite: Selects between a dark and a light border depending on the object color.
Shadow: The border has shadow.
7.3.3. Y Axis
You can to change Y Axis Settings
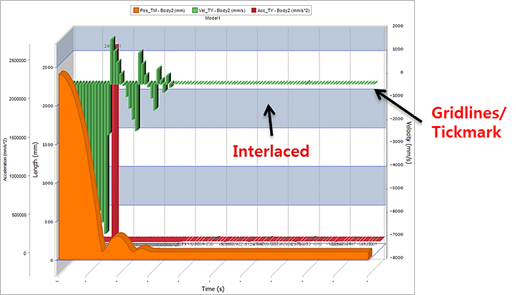
Figure 7.86 Y Axis Settings of Chart
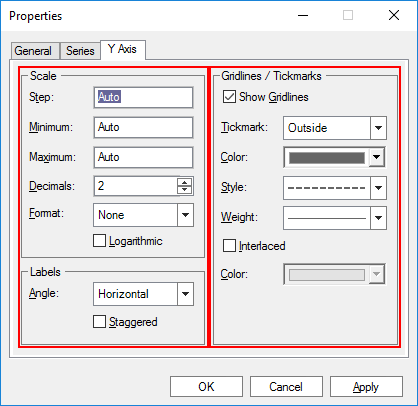
Figure 7.87 Y Axis of Chart Properties dialog box
Scale Settings
Labels Settings
Gridlines/Tickmarks Settings
Tickmarker
None: Hides tick marks for the selected axis.
Outside: Displays tick marks on the outside of selected axis.
Inside: Displays tick marks on the inside of selected axis.
Across: Displays tick marks that cross inside and outside of selected axis.