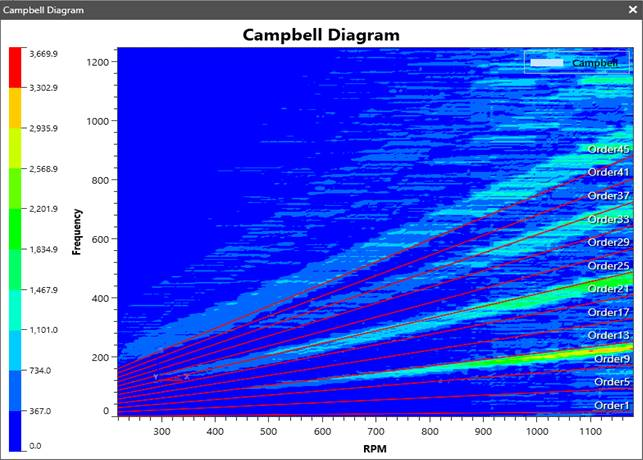
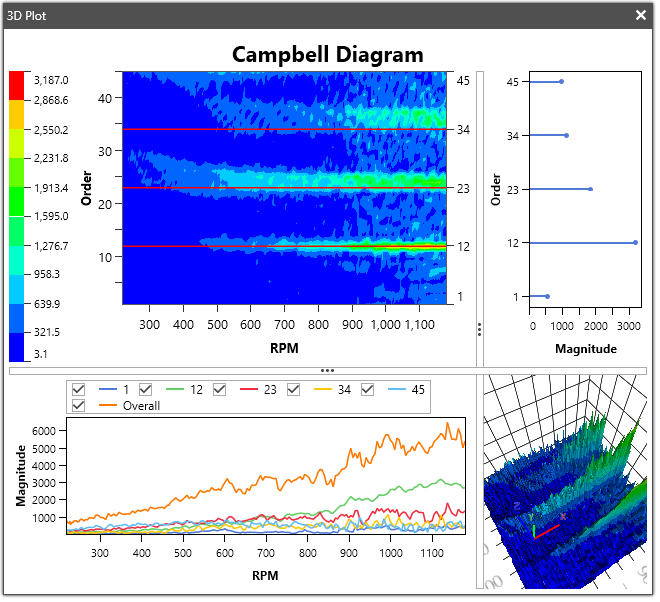
8.4.3.4. Color Map
When the View Type of the Plot3D is set as the Ortho View, The Campbell Diagram is shown as color map.
Context Menu
Type |
Description |
|---|---|
Fit |
Adjusts the axis visual ranges to fit the series data and restore camera location. |
Display Tooltip |
Display tooltip that contains the information of the series data values on the mouse point. |
Additional Viewer |
It shows the additional viewer that indicate section viewer and slice viewer. |
View Type |
Change the Plot3D view type. One is Normal, another is Ortho View. When the View Type is Ortho View, the camera will be set automatically orthogonal against x-axis and z-axis. |
Campbell Properties |
Open the properties window of the Campbell Diagram. For more information, click here. |
Section Viewer Properties |
Open the properties window of the Section Viewer. For more information, click here. |
Slice Viewer Properties |
Open the properties window of the Slice Viewer. For more information, click here. |
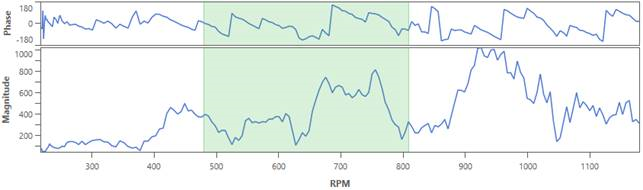
Section Viewer
When the Section Viewer menu on the context menu is checked, the additional 2D charts are shown as below figure.
Context Menu
Type |
Description |
|---|---|
Display Tooltip |
Display tooltip that contains the information of the series data values on the mouse point. |
Curve Color |
Change the curve color. |
Add to Plot |
It makes a series to the 2D Plot. If there is no 2D Plot in model, new plot document will be added in same model document. |
Mouse Drag Zoom
Section chart supports zoom with mouse drag. Zoom only works on the x-axis. The section chart fits with the double mouse click.
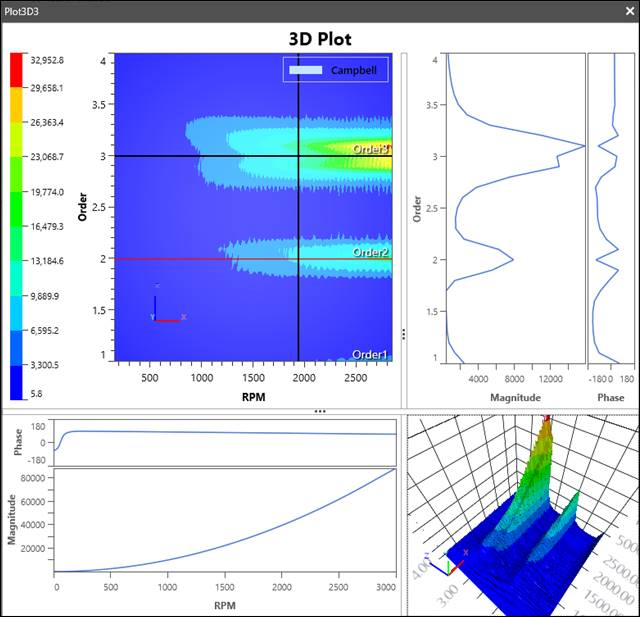
Slice Viewer
When the Slice Viewer menu on the context menu is checked, the slice viewer is shown as below figure.
Context Menu
Type |
Description |
Fit |
Fit the drawn series in overlay chart. |
Display Tooltip |
Display tooltip that contains the information of the series data values on the mouse point. |
Add to Plot |
It makes a series to the 2D Plot. If there is no 2D Plot in model, new plot document will be added in same model document. |
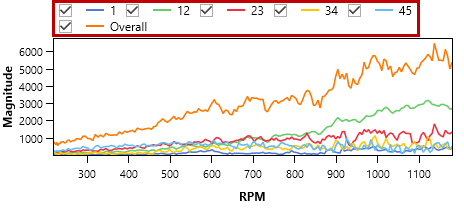
Visible the series using checkbox
The series can be visible or invisible using checkbox on the legend box in the overlay slice chart.