20.8.1. Bode
Bode tool reports a state-space matrix and a Bode diagram of CoLink system. Bode tool computes a TF (transfer function) of CoLink system with a selected simulation time. And then it makes a Bode diagram. State-space matrix is a residual when Bode makes TF. Bode diagram is a graphically displaying method for frequency analysis. A variation of magnitude and phase delay is shown in logarithmic scales with growing frequency.
When the user uses the Bode tool, the CoLink system must be a RecurDyn plant block. Inputs of a CoLink system are defined outputs of a RecurDyn plant block. And also, Outputs of a CoLink system is the same inputs of a RecurDyn plant block. That’s why it needs a RecurDyn plant block.
First of all, the Bode tool makes a state-space matrix in order to get TF. State-space matrix is as Eq 1.
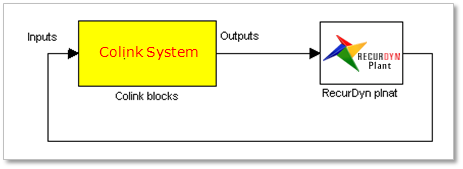
Figure 20.199 Definition of input and output
\(\dot{x}=Ax+Bu\)
Where, \(x\), \(y\), \(u\) are state variable vector, outputs and inputs, respectively.
Therefore, a TF of CoLink system is computed as (20.2).
For frequency analysis Bode tool is convenient to use \(s=j\omega\). The \(s\) is an imaginary number of complex and called frequency. A variation of magnitude and phase delay is computed as (20.3). with selected frequency \(\omega\).
The magnitude and phase are computed this sequence with growing input frequency. And The results are displaying in Bode diagram with logarithmic scales.