7.1.6.5. Draw and Export
The user can draw and export a value on selected time, a maximum value, a minimum value, or an average value on selected time range. This function is only activated when entering Plot mode with Plot Result with Multi Imported Data function.
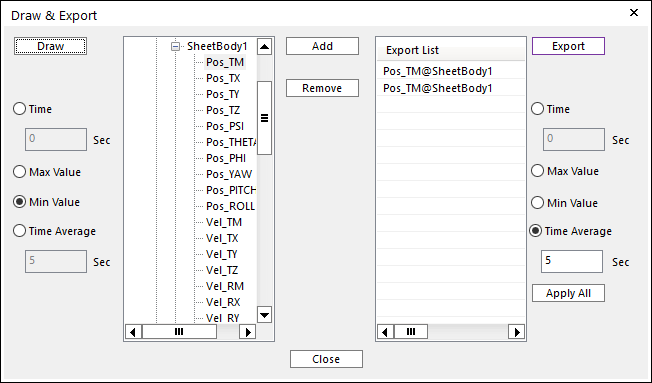
Figure 7.32 Draw & Export dialog box
Draw: After selecting a plot item on the tree dialog, the data was drawn as the selected option.
Options
Time: Draws a value on the selected time.
Max Value: Draws a value for the maximum value among the total data.
Min Value: Draws a value for the minimum value among the total data.
Time Average: Draws a value for the average value of the data from 0 sec to the selected time.
Add/Remove
In order to export the data as the selected option, the plot data should be added on Export List dialog.
Export List: Although the plot data names are same on Export List dialog, the selected options can be different. When clicking the name on Export List dialog, the selected option can be shown on the right option menu that is same to the left menu.
Apply All
If clicking Apply All, all data on Export List dialog is exported as the selected one option on the right option menu.
Export: All data on Export List dialog is exported to a file.
Step to Draw
Selects a plot data on a tree dialog
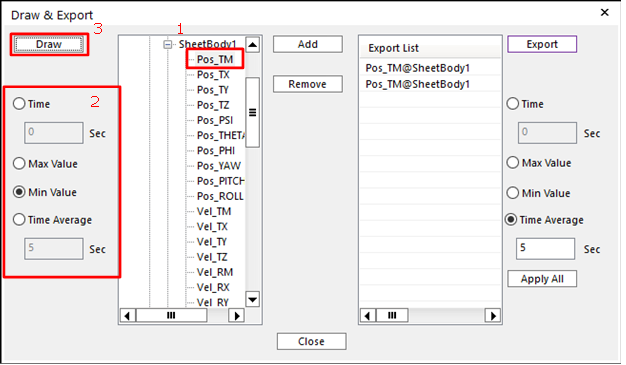
Choose an option.
Click Draw.
Step to Export
Selects a plot data on a tree dialog
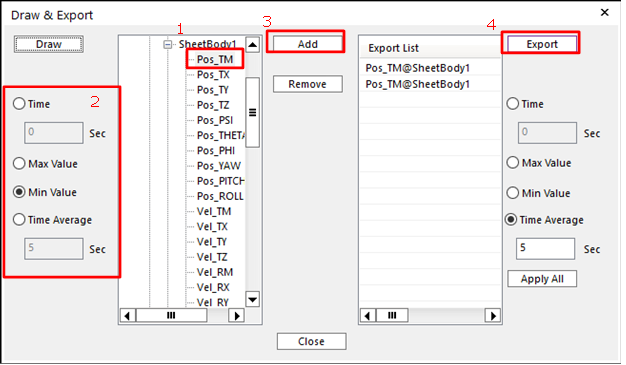
Choose an option.
Click Add to add it on Export List.
Click Export.