21.2.3.2. Analysis Response
Analysis Responses are a candidate set of performance indexes. In AutoDesign, the design objectives and the functional constraints are defined by using the performance indexes that are selected from analysis responses.
The follows are the steps and options for definition
21.2.3.2.1. Step for definition
Select the Response icon of the Parameter group in the AutoDesign tab.
Figure 21.23 Response icon of the Parameter group in the AutoDesign tab
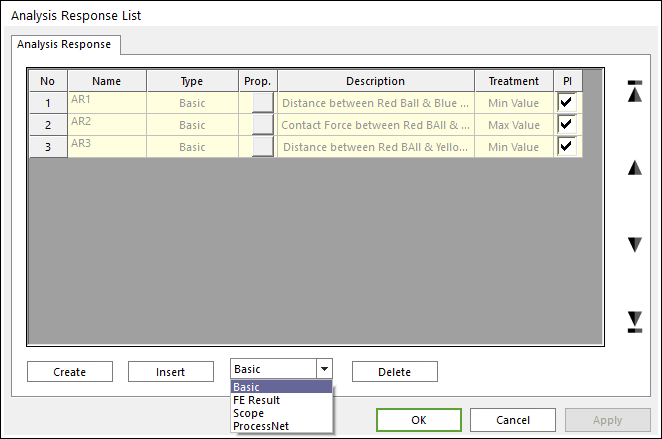
Figure 21.24 Analysis Response List dialog box
Click the Create or Insert Button (in Figure 21.24)
Define an Analysis Response
As the explanation of Analysis Response, analysis response must be defined as one of four types. The types are ‘Basic’ ‘FE Result’ ‘Scope’ and ‘ProcessNET’. ‘Basic’ is related to an expression in the ‘Expression List’. The time domain response from selected type is treated by the ‘treatment’ option, and that value is defined the performance index in the AutoDesign process.
21.2.3.2.2. Option for the definition Analysis Response
Basic
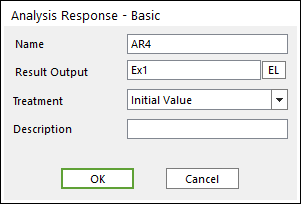
Figure 21.25 Analysis Response - Basic
Result Output: The EL button changes the dialog as Expression List. Then Allows you to select the expression related the performance index.
Treatment: One can select the treatment option for performance index. There are ten options. That is explained in next chapter.
Description: One can describe the analysis response in the Description blank.
FE Result
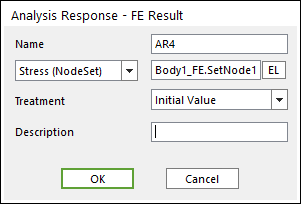
Figure 21.26 Analysis Response - FE Result
Stress (Node Set)/ Stress (Element Set)/ Mass (Element Set): One can define the name of the node set or element set in the blank using navigation those on the Working Window from the EL button.
Treatment: One can select the treatment option for performance index. There are five options. That is explained in next chapter.
Description: One can describe the analysis response in the Description blank.
Scope
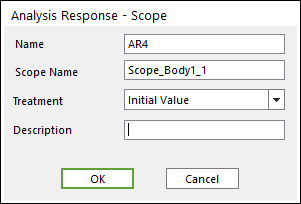
Figure 21.27 Analysis Response – Scope
Scope Name: One can define the name of scope in the blank using dragging and dropping a Scope from the Database Window.
Treatment: One can select the treatment option for performance index. There are ten options. That is explained in next chapter.
Description: One can describe the analysis response in the Description blank.
ProcessNET
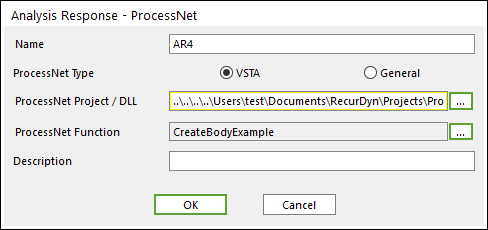
Figure 21.28 Analysis Response - ProcessNET
ProcessNET Project / DLL: One can define the name of ProcessNET project or DLL using … button.
ProcessNET Function: One can select the name of ProcessNET Function for performance index using … button. The defined ProcessNET function must use SetAnalysisResponseResult function of IModelDocument interface.
Description: One can describe the analysis response in the Description blank.
21.2.3.2.3. Analysis Response Treatment Option
Initial Value
The initial value of the analysis response is defined as performance index.
End Value
The end value of the analysis response is defined as performance index.
Average Value
The average value of the analysis response is defined as performance index.
Min Value
The minimum value of the analysis response is defined as performance index.
Max Value
The maximum value of the analysis response is defined as performance index.
Min ABS Value
The minimum value of the absolute analysis response is defined as performance index.
Max ABS Value
The maximum value of the absolute analysis response is defined as performance index.
RMS Value
The root mean square value of the analysis response is defined as performance index.
Max Deviation
The maximum deviation value of the analysis response is defined as performance index.
SD Value
The standard deviation value of the analysis response is defined as performance index.
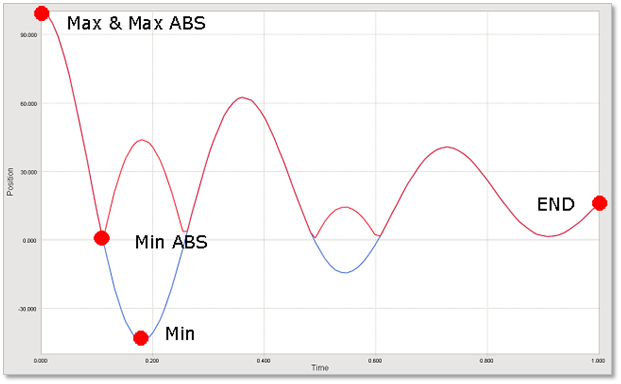
Figure 21.29 Example of treatment for analysis response