21.3.6.2. Design For Six-Sigma (DFSS)
In general, standard deviation is the best measure of process or design variability because the smaller the standard deviation, the less variability in them. If one can reduce sigma \(\sigma\), to the point that the specifications are at \(\pm 6\), then \(99.9999998\text{ }\%\) of the product or design is between specifications. Figure 21.82 shows the feasibility of both sided inequality constraints. Suppose that three colored distributions have same center but different sigma. If one distribution satisfies the relation of \(\left| U-L \right|\ge 6\sigma\), then we say that it satisfies 6-sigma constraints.
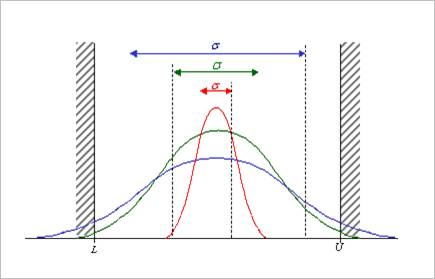
Figure 21.82 Feasibility of several distributions with same centers
In the practical design, the inequality constraints have only one-side limitation such as equation (4) in Robust Design Optimization. Figure 21.83 shows the feasibility of several distributions with shifted centers. If you change the design variables \(\left( \mathbf{x} \right)\), the mean and variance of a performance \({{g}_{j}}\left( \mathbf{x} \right)\) is changed, even though all design variables have same variations \(\mathbf{\delta }\).
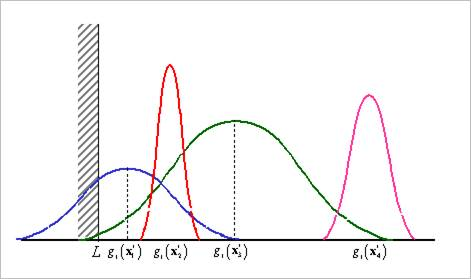
Figure 21.83 Feasibility of several distributions with shifted centers
Next, the definition method of 6-sigma is explained. In the Robust Design Optimization window, PI should be defined as Constraint. Then, its goal is selected from LE or GE types. In the following figure, Nip spring force is selected as LE type constraint. Also, its value should be less than 10. The robust index is defined as “1”. In AutoDesign, this inequality constraint is represented as:
\(Nip\_Force\left( \mathbf{x} \right)+1\cdot \sigma \left( \mathbf{x} \right)\le 10\)
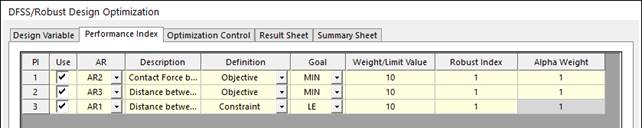
If one defines the robust index as “6”, then the nip force constraint is 6-sigma constraint as
\(Nip\_Force\left( \mathbf{x} \right)+6\cdot \sigma \left( \mathbf{x} \right)\le 10\)
As you define the robust index between 0 ~ 6, the percent feasibility is changed. Table 21.2 shows the percent between robust index and the feasibility of inequality constraints.
Robust Index |
Percent Feasibility |
1 |
68.7 |
2 |
95.45 |
3 |
99.73 |
4 |
99.9937 |
5 |
99.999943 |
6 |
99.9999998 |