21.2.3.6. Reliability Analysis by using SAO method
In order to evaluate the probability of failure, SAO based hybrid method is provided. It finds the most probable point (MPP) by using meta-model based SAO and then uses the dimension reduction to integrate the probability of failure at the MPP.
21.2.3.6.1. Run Steps of SAO based Reliability Analysis
Select the SAO icon of the Reliability group in the AutoDesign tab.
Figure 21.55 SAO icon of the Reliability group in the AutoDesign tab
Define the information of random constant
Check Design Variable in the Reliability: SAO dialogue and select the probability distribution and deviation value type. The current values of the selected variables are regarded as mean values. As the selected design parameters (DP) are random constants, their types are represented as Constant.
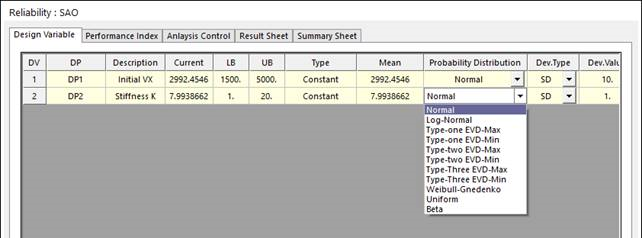
Figure 21.56 Design Variable tab of the Reliability : SAO dialog box
Probability Distribution: For reliability analysis, one should define the probability distribution type for each random constant. AutoDesign provides 11 types of probability distributions. The detailed information of the probability distributions is explained in Probability Distributions.
Deviation type: The standard deviation types. SD is ‘standard deviation value’. COV is ‘coefficient of variance’, which is SD/Mean value.
Define the limit state function
Check Performance Index in the Reliability: SAO dialogue and select the analysis responses to define the limit state relation. Figure 21.57 shows that AR1 is less than its’ limit. This represents that the system is failed when AR1 is greater than its’ limit.
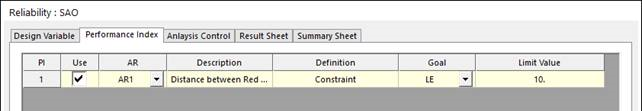
Figure 21.57 Performance Index tab of the Reliability : SAO dialog box
Define the Analysis Control
Check Analysis Control in the Reliability: SAO dialogue. The convergence tolerances for objective change rate and limit state value are recommended as 0.01 and 0.001. The three reliability analysis solvers are provided such as AFORM, AFORM+DRM1, and AFORM+DRM2. The detailed information is explained in Reliability Analysis. AFORM+DRM2 is more accurate than AFORM+DRM1. In order to construct the meta-model, three methods are providing such as Koshal Method’, Latin Hypercube Sample, and Get From Simulation History.
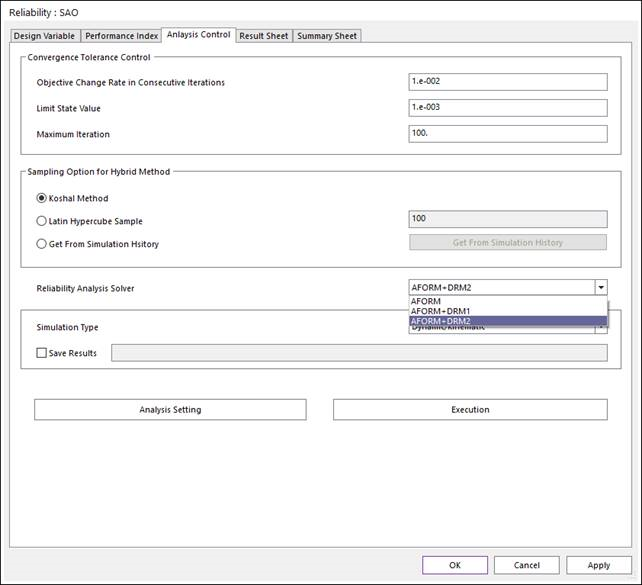
Figure 21.58 Analysis Control tab of the Reliability : SAO dialog box
21.2.3.6.2. Result Sheet of Reliability Analysis: SAO
Check Result Sheet in the Reliability: SAO dialogue. If the values of reliability index error; and critical limit function error go to ‘zero-value’, the reliability analysis is successfully converged. See the red colored circle. This represents that the most probable point is obtained from AFORM approach. Then, the failure probability is 51.06(%).
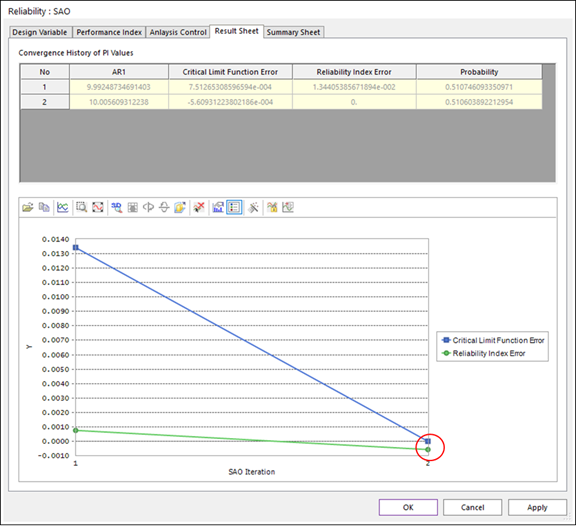
Figure 21.59 Convergence history
21.2.3.6.3. Summary Sheet of Reliability Analysis: SAO
Check Summary Sheet in the Reliability: SAO dialogue. Then, you can see the reliability analysis result. Statistical Variables lists the random constant information. Param_1 ~ Param_3 are the statistical values for defining the probabilistic distributions, which are internally evaluated from the given information such as mean, standard deviation and distribution type. Performance Index (Formulation) lists the limit state function formulation.
Performance Index (Result) list the reliability analysis results, which should be nearly zero at MPP. Reliability index denote the minimum distance from mean value to MPP. The probability of failure is the modified failure by using DRM. In the convergence history, AFORM gave ‘0.5106’. The modified failure is ‘0.5057’, which is more accurate result. If you need the detailed theory, you can see Reliability Analysis.
Most Probability Point Information gives a design guide. First, it shows MPP location (2992.54876, 7.969). D(Beta)/D(Mean) represents the design sensitivity values. If this value is positive, then the reliability index is increased by increasing mean value. Also, D(P)/D(Mean) value is the derivative of failure probability with respect to mean value. Figure 21.60 shows that DP2 is more sensitive than DP1.
Finally, total number of analyses is summarized. The SAO method uses only 12 evaluations to find the failure probability of system. The SAO based AFORM used 8 evaluations and DRM2 used 4 evaluation. Next, by comparing the results of Monte-Carlo simulation, you can see SAO approach is most efficient.
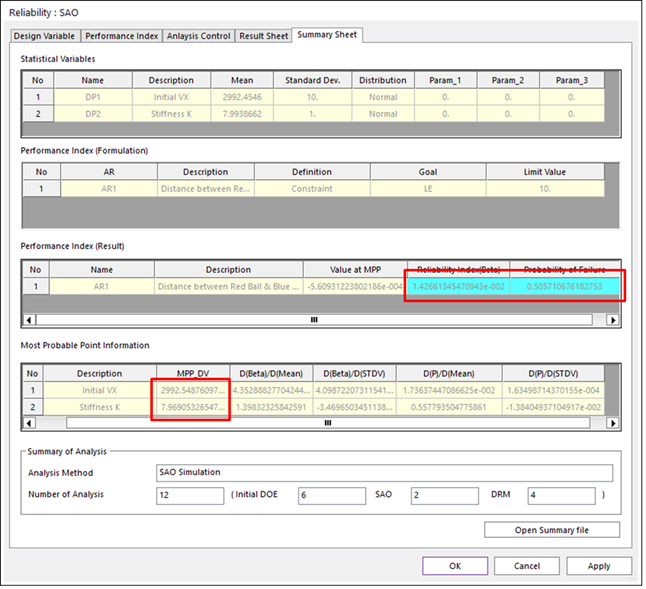
Figure 21.60 Summary Sheet