8.1.9.1. Plot2D Window
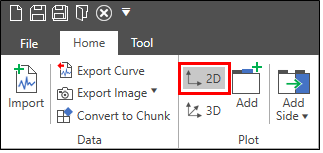
Plot2D window can be created from ribbon menu. To create Plot2D, check the 2D radio button and click the Add button or Add Side buttons.
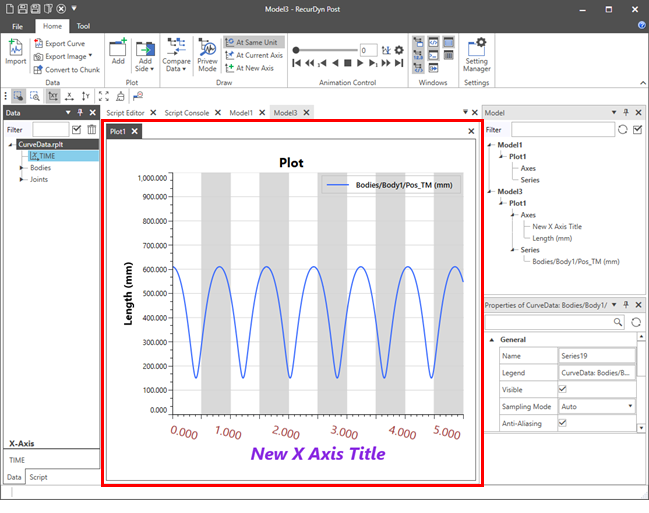
It shows the model including the plot2D window with the series drawn.
Context Menu
Menu |
Type |
Description |
Plot |
Clear All |
Clear all drawn series on the activated plot window. |
Open Properties |
Open the properties for the selected plot window. Click here for the property information. |
|
Fit |
Fit the drawn series. |
|
Mouse Drag Action |
Set which function to work with dragging the mouse between Select Zoom and Select Series. Click here for additional settings. |
|
Display Tooltip |
Set whether all supported tooltips are shown or not. Click here for additional settings. |
|
Copy to Clipboard |
Copy an image to clipboard. You can paste the activated plot image. |
|
Paste Series |
Paste data to the activated plot window. |
|
Series |
Delete |
Delete the selected series. |
Open Properties |
Open the properties for the selected series. Click here for the property information. |
|
Open Data Table |
Show data for the selected series in Data Table with table format. Click here for Data Table. |
|
Copy to Clipboard |
Copy data to clipboard. You can paste the selected series on other plot windows. |
|
Axis |
Open Properties |
Open the properties for the selected axis. Click here for the property information. |
MediaPlayer |
Open Properties |
Open the properties for the selected Media Player. Click here for the property information. |
Shortcut
Key |
Description |
Delete |
Delete the selected series. |
C |
Clear all drawn series. |
F |
Fit the drawn series. |
P |
Open the properties window for the selected series or axis or current plot. |
S |
Set mouse drag action into the Select Series. |
Z |
Set mouse drag action into the Select Zoom. |
T |
Set whether the ToolTip are shown or not. |
Ctrl + F |
Saves the current visible range of all axes in the chart. |
Ctrl + Z |
Restores the visible range of all axes in the chart. The visual ranges will be set by data which stored from the SaveCurrentVisualRange (Ctrl + F) function. |
Q |
Set the XY Direction for the Select Zoom action. |
W |
Set the X Direction for the Select Zoom action. |
E |
Set the Y Direction for the Select Zoom action. |
Ctrl + C |
Save the various data to clipboard at once.
|
Ctrl + V |
Paste the data representing the series information from the clipboard data into the current chart. |